Predicting Shelf Life from Accelerated Aging Data: The D&A and Variable Q10 Techniques
The medical device industry has long been interested in techniques for predicting the shelf life of polymer-based devices. This year, that interest will increase substantially. As of June 14, 1998, the European Union is banning the sale of sterile or degradable medical devices that have no expiration dates.
June 1, 1998
Now more than ever, developers of polymer-based medical products need ways to ensure a product shelf life of five or six years. Because real-time testing is impractical, accelerated aging techniques must be used. However, the two best-known techniques for predicting the future properties of polymers using accelerated storage data, the Arrhenius and the Q10 equations, are not reliable for most medical devices. Fortunately, alternative techniques are available. The two methods described below are relatively easy to use, and have been shown to be more accurate in predicting actual shelf life than the better-known techniques.
THEORY VERSUS REALITY
Many polymers important to the medical device industry are damaged by the radiation required to sterilize them. This damage can involve embrittlement (as in polypropylene), discoloration (as in polycarbonate), or additive blooming (as in polyvinyl chloride). Often the chemical damage is not complete when the radiation stops, but continues in a "dark reaction" for some time, often years.
Manufacturers need to know how devices will perform throughout their required shelf lives, often as much as four to five years after irradiation. Storage at high temperatures is used in accelerated aging testing to speed the chemical degradation processes. Test results of these accelerated aging samples are mathematically manipulated to yield a prediction of the performance of products aged at room temperature.
The rates of chemical reactions, within the limits of certain restrictions, increase with temperature, as described by the Arrhenius equation. This equation says that log rate (ln K) is proportional to the inverse absolute temperature (1/T) multiplied by the reaction's energy of activation (Ea) divided by R, the universal gas constant:
ln KT= A x Ea/RT or KT = 'A exp(Ea/RT).
The ratio of the rates at two different temperatures yields the Arrhenius shift factor
a(T) = KTH / KTL = exp (Ea/R(1/TL –1/TH))
where KTH and KTL are the rates at the higher and lower temperatures, and TH and TL are the higher and lower temperatures in Kelvin.
The dark reaction that eventually embrittles irradiated polypropylene is the degradation of peroxides that are formed by radiation-induced free-radical oxidation and the concomitant scissions to chains of lower molecular weight. The breakage of peroxide bonds, in general, is well described by the Arrhenius equation. However, polypropylene is not a homogeneous material. The peroxides formed vary in stability, some breaking much sooner than others. In terms of the equation, the energy of activation, or Ea, is not constant for peroxide decay.
As the peroxides break, new free radicals are formed. These react with oxygen (which diffuses into the polymer) to form new peroxides, and so on. Obviously, oxygen is more available near the surface of the device than in its interior. Because polypropylene is semicrystalline, it contains amorphous regions, which serve as canals for oxygen diffusion, as well as crystals, which impede oxygen penetration and free-radical oxidation.
Given all these heterogeneous effects, it's clear that even the chemical reactions that are being accelerated can be expected to deviate from the Arrhenius equation. In addition, physical complications must be accounted for.
For example, the force required to bend polypropylene tubes decreases by as much as 25% when they are aged for several years at 25°C, during which time their molded-in stress relaxes. But when aged at 60°C, identical tubes get stiffer instead of softer. Annealing of crystallinity is significant at 60°C and negligible, in comparison, at 25°C. Obviously, process conditions will decide the amount of molded-in stress and, therefore, the importance of this perturbation of the mechanical data.
Processing also determines the mechanical properties for the skin layer of such tubes.1 The rapidly quenched surfaces of the tubes can dominate breakage properties by crack-propagation mechanisms. The design of the molded part can also affect the rate of embrittlement at various temperatures. Because of the role played by oxygen diffusion in postirradiation degradation, thin polypropylene oxidizes, or embrittles, faster than thick polypropylene. And, of course, a flawed design, such as an unradiused corner, will fail earlier than a good one. All these complications ensure that, in most mechanical tests of industrial significance, the breakage data collected over time at the aging temperatures will not obey the Arrhenius equation.
There are, of course, special situations in which postirradiation accelerated aging data will closely follow the Arrhenius equation. For example, the rate of decrease in elongation at break of irradiated dog bones aged at various temperatures can be well correlated to the polymer's molecular weight. The change in molecular weight will be well modeled by the Arrhenius equation. Therefore, the mechanical data for this test and device will obey the equation. This obedience will be seen in a graph of the data. For example, the log of the aging time required at each temperature for the elongation at break to drop to half its initial value will be a straight line when graphed against the inverse absolute temperatures.2
For most medical devices, however, accelerated aging data will yield curved rather than straight lines. The curvature, however, will contain important predictive information regarding the future properties of the naturally aged devices. This fact leads to the two alternative predictive methods described below.
THE D&A METHOD
The D&A method, named for the authors and first described by us in 1990, is one alternative to the Arrhenius equation.3 It requires little theoretical background or information about material properties.
The properties it can predict may be the brittleness of an injection-molded plastic part, the number of package seal failures, the color of the plastic, or the stability of an antithrombogenic device surface. The tests to be performed, correspondingly, could be a bending test, a ship test or dye penetration package test, a colorimeter test, or a radiation scintillation count of labeled blood platelets on an implanted or extracorporeal device. The complete protocol for this methodology involves 10 steps, which are described elsewhere.4 Only the graphical method of the D&A process (step 9) is presented here.
Data Treatment. Figure 1 shows the angle-at-break aging data for polypropylene tubes stored at 25°, 40°, and 60°C following 3.5 Mrd of cobalt irradiation. The tubes were periodically broken in a three-point bending test. For the tubes stored at 60°C, there are 20 aging weeks of data; for the others, 50.
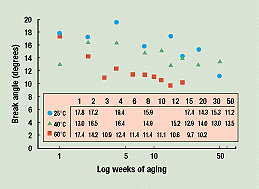 Figure 1. Polypropylene tube break angles versus weeks of aging for 25°, 40°, and 60°C storage temperatures. The break-angle data for each temperature are shown in the inset box.
For our purposes, these three sets of data points must be turned into three continuous curves. To do this, we used the following technique. All the math steps can be repeated by readers who want to step through the shelf life predictions shown here.
Figure 1 shows the data on a scale of break angle versus log of weeks at the three storage temperatures. For the 25°C data, the high 4-week and low 50-week points are disregarded. The rest of the data, analyzed by linear regression, yield the straight line shown in Figure 2. The same process is applied to the 40°C data (dropping the low 1-week point). After dropping the low 3-week point from the 60°C data, the rest can be well fitted by an exponential decay.
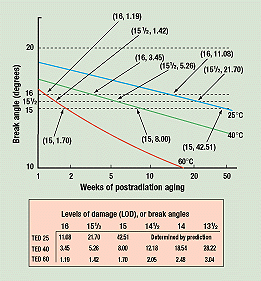 Figure 2. Break-angle data points converted into curves. The converted data for time to equivalent damage (TED) for each temperature are listed in the inset box.
The equations of the straight lines obtained are:
Break angle for 25°C = (–1.71) x (log of weeks at 25°C) + 17.79
Break angle for 40°C = (–2.74) x (log of weeks at 40°C) + 17.47
Log break angle for 60°C = (–0.1811) x (log of weeks at 60°C) + 1.2177
The last straight line can be expressed as the exponential decay shown in Figure 2:
Break angle for 60°C = (weeks)–0.1811 x 101.2177 = (weeks)– 0.1811 x 16.51
The three continuous curves obtained allow us to calculate how many weeks it took at each temperature for the break angle to drop to 16 degrees and lower, at half-degree increments. (For this test, average break angles are the levels of damage, or LODs, referred to in the figures.)
Figure 3 is a cross-plot of Figure 2, showing how much aging time it took at each of the three temperatures for the break angle of the samples to drop to 16, 15½, and 15 degrees. In one year, 15 degrees is the lowest break angle exhibited by the samples stored at 25°C. Therefore, the curves for these three break angles are the only complete ones. Figure 3 also shows when 60° and 40°C samples reached average break angles of 14½, 14, and 13½ degrees.
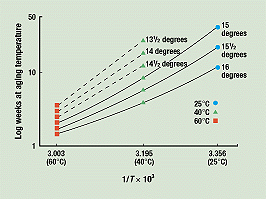 Figure 3. Cross-plot of converted data from Figure 2. Solid lines show aging time for samples in each of the three storage temperatures to reach break angles of 16, 15½, and 15 degrees. The broken line indicates the time for the samples stored at 40° and 60°C to reach break angles of 14½, 14, and 13½ degrees.
We used the curvatures of the three completed curves to finish those for 14½, 14, and 13½ degrees—that is, to extend them to 25°C. This process thus predicts when the tubes stored at 25°C will degrade to these average break angles.
Measuring Curvature. The curvatures of the completed curves are measured as shown in Figure 4 for break angles of 16 and 15½ degrees. For each, the data points for the 60° and 25°C samples are connected by a straight line on this semi-log graph. Since the shape of the curves is concave up, the straight lines pass through the 40°C axis at values of log aging time higher than the measured logs of times to equivalent damage (TED) at 40°C (TED 40) for these break angles.
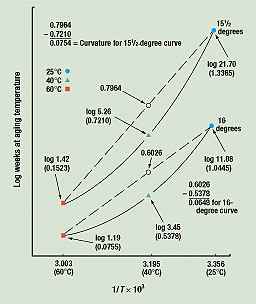 Figure 4. Curvature of completed data curves. The difference between the 40°C point on the curved line and the 40°C point on the straight line constitutes a measurement of the curvature. (The vertical scale is distorted for clarity.)
The arithmetic shown in Figure 4 is as follows. The break angles at 60°, 40°, and 25°C reached 16 degrees at 1.19, 3.45, and 11.08 weeks, respectively. The logs of these numbers are 0.0755, 0.5378, and 1.0445 (see the table in Figure 2).
When these logs are graphed against their inverse absolute temperatures, the curves in Figure 4 result. Then, when a straight line is drawn from the 60°C point for a break angle of 16 degrees (3.003, 0.0755) to the 25°C point for the same break angle (3.356, 1.0445), the line intersects the 40°C axis (3.195) at a value of 0.6026.
The time to equivalent damage at 40°C for a break angle of 16 degrees is 3.45 weeks or a log of 0.5378. The distance between this point and the straight line's intersection with the 40°C axis is 0.6026 minus 0.5378, or 0.0648. This difference measures the curvature of the 16-degree break-angle curve by measuring its departure from a straight line. Similar calculations were performed for the 15½- and 15-degree curves (the latter curve is not shown in Figure 4), yielding values of 0.0754 and 0.0877, respectively. The curvatures obtained from these three completed curves can now be extrapolated into the future to predict when samples aged at 25°C will have break angles of 14½, 14, and 13½ degrees, and lower.
Predicting Shelf Life. Figure 5 is a graph of curvature versus break angle. The values measured in the preceding paragraph are 0.0648 for the 16-degree break-angle curve, 0.0754 for the 15½-degree curve, and 0.0877 for the 15-degree curve. A straight line through these points on the graph yields predicted curvatures of 0.0990 for 14½-degree break angles, 0.1105 for 14-degree break angles, 0.1220 for 13½-degree break angles, and 0.1335 for 13-degree break angles.
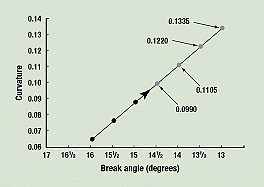 Figure 5. Curvature versus break angle. A straight line through the actual values for the 16-, 15½-, and 15-degree break angles (black dots) is used to predict the curvatures for break angles of 14½, 14, 13½, and 13 degrees.
As shown in the data table for Figure 2, we already have the values for TED 60 and TED 40 at these levels of damage, or break angles. For a break angle of 14½ degrees, adding the predicted curvature of 0.0990 to the measured log of TED 40 (log 12.18 = 1.0856) yields 1.1846—that is, the point (3.195, 1.1846).
Figure 6 shows that a straight line from the 60°C data point (3.003, 0.3118) through the 40°C intersection just calculated (3.195, 1.1846) intersects the 25°C axis (3.356) at the time to equivalent damage (TED 25) predicted for a break angle of 14½ degrees. The time predicted is the inverse log of 1.9165, or 82½ weeks. Similar calculations can be performed for break angles of 14 and 13½ degrees, yielding times of 160 weeks (just over 3 years) and 306 weeks (almost 6 years), respectively.
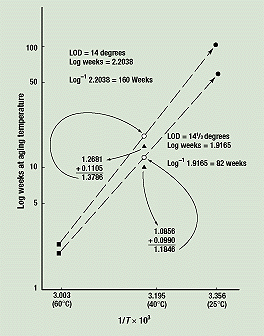 Figure 6. Predictions of times to equivalent damage for samples stored at 25°, 40°, and 60°C.
This completes the shelf life prediction for this collection of irradiated polypropylene tubes. We have concluded that 3 weeks of storage at 60°C is equivalent to 28 weeks at 40°C and 6 years at 25°C. Thus, if tubes have acceptable ductility after 3.04 weeks at 60°C or 28.22 weeks at 40°C, then tubes aged 6 years at 25°C will also be acceptable.
VARIABLE Q10 METHOD
The Q10 method is another well-known predictive technique. It assumes that the ratio of the times to equivalent damage at two temperatures, usually 10°C apart, has a constant value. The Q10 method is not very accurate in practice. And, contrary to popular belief, it does not obey the Arrhenius equation. For data that follow that equation, Q10 will decrease as temperature increases. This suggests the use of a modified Q10 method in which the ratio of TEDs is used as a variable.
The data used for this example are the same as for the completed curves in Figure 2 for break angles of 16, 15½, and 15 degrees. The well-known Q10 equation is used:
Q10(TH – TL )/10 = TED TL/TED TH
First, Q10 values are calculated using this equation and the known values of TED 60 versus TED 25 shown in Figure 2. For a break angle of 16 degrees, the calculation is as follows:
Q10(60–25)/10 = 11.08/1.19
Q103.5 = 9.31
Q10 = 9.311/3.5 = 1.89
The same calculation for break angles of 15½ and 15 degrees yields Q10 values of 2.18 and 2.51, respectively.
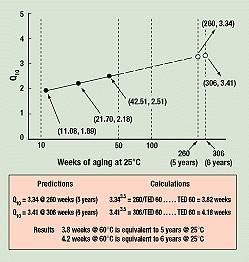 Figure 7. The variable Q10 method, comparing 60° and 25°C data. The solid dots indicate Q10 values calculated from these data versus the actual times to equivalent damage at 25°C for break angles of 16, 15½, and 15 degrees (11.08, 21.70, and 42.51 weeks, respectively). The extrapolated broken line predicts future values of Q10 for 25°C compared to 60°C. Thus 3.8 weeks at 60°C would be equivalent to 5 years at 25°C.
Figure 7 is the resulting graph of Q10values versus the log of TED 25. A straight line through the three Q10 data points intersects the axis for 260 weeks (5 years) at a Q10 value of 3.34. Plugging this Q10 into the equation
3.34(60–25)/10 = 3.343.5 = 260/TED 60
yields a TED 60 of 3.8 weeks.
Therefore, exposure of 3.8 weeks at 60°C is predicted to decrease break angle as much as would 5 years at 25°C. This is not the same answer as that of the D&A method, which concluded that 3.04 weeks at 60°C had the effect of almost 6 years at 25°C. The answers, however, are reasonably close. For 6 years, the intersection is at a Q10 of 3.41, yielding 4.2 weeks at 60°C, equivalent to 6 years at 25°C.
The variable Q10 method only requires one accelerated set of data and one 25°C set of data. Since we had data for 40°C as well, however, we also calculated these results. The calculations suggested that the effect on break angle of 30.1 weeks at 40°C is the same as 5 years of aging at 25°C. By comparison, the D&A method predicted that 28.22 weeks at 40°C was equivalent to almost 6 years at 25°C. The Q10 method predicts that 6 years of aging at 25°C is equivalent to 34.2 weeks at 40°C.
CONCLUSION
Of the two alternative prediction techniques discussed above, the Q10 method is less expensive to perform (since only one accelerated storage condition is required). Some practitioners may find the math to be easier, as well. The value of Q10 is assumed to be extrapolatable, and it usually is.
The D&A method, however, can be considered the "Cadillac" technique for shelf life prediction because it assumes nothing, using only the data to predict the future. It uses all the information contained in the data (that is, values and curvatures). For this reason, it is the best possible prediction technique.
ACKNOWLEDGMENTS
A version of this article first appeared in the technical information report produced by the ISO 11137 Radiation Sterilization Materials Working Group and presented at the MD&M West conference in February 1997. The authors are grateful to Karl Hemmerich and James Stubstad for inviting them to participate.
REFERENCES
1. Fujiyama M, Wakino T, and Kawasaki Y, "Structure of Skin Layer in Injection-Molded Polypropylene," JAPS, 35:29–49, 1988.
2. Gillen KT, Clough RL, and Wise J, "Extrapolating Accelerated Thermal-Aging Results: A Critical Look at the Arrhenius Method," in Polymer Preprints, Washington, DC, American Chemical Society, 34(2):185, 1993.
3. Donohue J, and Apostolou S, "Shelf-Life Prediction for Radiation-Sterilized Plastic Devices," Med Dev Diag Indust, 12(1):124– 129, 1990.
4. Donohue J, and Apostolou S, "Predicting Post-Rad Shelf Life from Accelerated Data: The D&A Process," Technical Papers, Brookfield, CT, Society of Plastics Engineers, 42:2819–2822, 1996.
John Donohue is technical director and Spiro Apostolou is president of Poly-Focus, in Clayton, MO.
Photo by Roni Ramos
Copyright ©1998 Medical Device & Diagnostic Industry
You May Also Like

.png?width=300&auto=webp&quality=80&disable=upscale)
