Determining Sample Size for Testing Equivalence
An MD&DI May 1997 Column HELP DESKDirector, corporate statistical resources, at Medtronic, Inc. (Minneapolis), explains the statistical strategies used during clinical trials for determining equivalence and offers ways to calculate sample sizes.
May 1, 1997
How do you determine the sample size in situations where you are trying to prove that the new treatment is at least equal to the existing control treatment? The study in mind is proposed to be conducted to support a premarket approval application rather than a 510(k).
Medical device manufacturers often undertake clinical trials to show that a new treatment is "as good as" or "equivalent to" an existing treatment. This is the case when manufacturers expect a new treatment method to be as effective as an existing one with added benefits such as fewer side effects, faster recovery, reduced cost, or other results that enhance patient quality of life.
To determine the trial's sample size, researchers must first define the null hypothesis that is appropriate for the equivalence study.
Traditionally, when clinical researchers compare two treatments, they want to prove that the effects of the two treatments are different. This is accomplished by setting the null hypothesis (H0) as follows:
H0: πS = πT
πS and πT represent the effects of the standard treatment and of the new treatment, respectively. Then, the researchers proceed by collecting data and performing statistical tests to reject the null hypothesis.
The objective is different in equivalence studies, however. Instead of rejecting the null hypothesis, researchers want to prove that it is true. One might think that this objective is accomplished when the statistical test fails to reject the null hypothesis. But failure to reject the null hypothesis is not enough to prove that the two treatment methods are equivalent. It only indicates that the evidence is insufficient to conclude that they are different.
While demonstrating complete equivalence is an impossibility, several approaches are available to prove substantial equivalence. A widely accepted strategy is to specify a value, d, so that a treatment difference that is less than d might be considered equally effective. This leads to the formulation of a null hypothesis different from the conventional approach.
For studies with a dichotomous response, let's assume that the event rates for the standard treatment group and the new treatment group are PS and PT, respectively. The null hypothesis is set as:
H0: PS –PT > d
and the alternative hypothesis, Ha, is:
Ha: PS –PT ≤ d
This leads to a sample size formula of:
N = (Zα + Zß)2 [PS (1 – PS) + PT(1 – PT)]
where N = the sample size for each treatment group, Zα = the standard normal variate corresponding to the α significance level, Zß = the standard normal variate corresponding to the tail probability of size ß, and d = that difference between the standard and new treatment effects that is considered to be clinically meaningful.
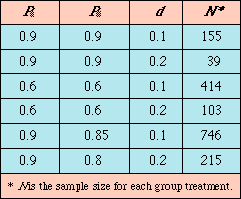
 Table I. Sample size calculations for α= 0.05, ß = 0.10.
This formula is slightly different from the sample size formula used in conventional hypothesis testing. In traditional comparative studies, the type I error, α, is usually set at 0.05, the type II error, ß, at 0.2. In equivalence testing, it is common to reduce the ß error to 0.1. Table I provides examples of sample size calculations for α = 0.05, ß = 0.10.
For studies in which two treatment means are compared (i.e., µS versus µT), the null hypothesis (of nonequivalence) can be written as:
Ho: |µS – µT | > d
and the alternative hypothesis, Ha, as:
Ha : |µS – µT |≤ d
This leads to the sample size formula:
N = 2 Δ2 ( Zα + Zß)2
where Δ = standard deviation of treatment effect.
This sample size formula is identical to its analog for the conventional hypothesis.
EXAMPLE 1
Researchers want to show that the new treatment is "as good as" the standard one. The success rates of both treatments are expected to be approximately 90%. The researchers want to be sure that a new treatment is no worse than the standard treatment by an amount of 10%. Then, the sample size for each treatment group is 155 patients (Table I).
EXAMPLE 2
Researchers want to show that a new treatment is equivalent to the standard one. A prior estimate of the standard deviation is 2.0, and the difference in treatment effect of 1.0 is considered clinically significant. Then, the sample size for each treatment group is:
N = (2)(2.0)2 (1.64 + 1.28)2 69
69
BIBLIOGRAPHY
Blackwelder WC, "Proving the Null Hypothesis in Clinical Trials," Controlled Clin Trials, 3:345–353, 1982.
Hintze J, "PASS 6.0: Power Analysis and Sample Size for Windows," NCSS Software, Kaysville, UT, chaps 12 and 18, 1996.
Machin D, and Campbell M, "Statistical Tables for the Design of Clinical Trials," Blackwell Scientif Pub, pp 35–53, 1987.
"Statistical Guidance for Clinical Trials of Non-Diagnostic Medical Devices," Rockville, MD, FDA, Center for Devices and Radiological Health, 1996.
Although every effort is made to ensure the accuracy of this column, neither the experts nor the editors can guarantee the accuracy of the solutions offered. They also cannot ensure that the proposed answers will work in every situation.
Readers are also encouraged to send comments on the published questions and answers.
Copyright ©1997 Medical Device & Diagnostic Industry
You May Also Like


.png?width=300&auto=webp&quality=80&disable=upscale)