Sign up for the QMED & MD+DI Daily newsletter.
Calculating Accumulated Lethality and Survivorship in EtO Sterilization Processes
The availability of two new equations makes it possible to compare the effects of dissimilar process cycles.
+4
16 Min Read
.svg?width=850&auto=webp&quality=95&format=jpg&disable=upscale "Calculating Accumulated Lethality and Survivorship in EtO Sterilization Processes")
 Sterility is a critical attribute of many parenteral products and medical devices. Understanding the dynamics of the various appropriate sterilization processes enables manufacturers and end-users to improve those technologies and to solve any problems that may arise.
In the area of thermal sterilization, the concept of accumulated lethality(FO)—the time of exposure to a lethal agent required to cause a selected reduction in the survivorship of a biological indicator (BI) population—has proven very useful. The availability of models describing survivorship when moist heat is the lethal agent has enabled researchers to compare the effects of dissimilar processes quantitatively. 1–3 Widely used by the technical community, the FO formula is accepted by FDA as an alternative method for measuring the effectiveness of a thermal sterilization process.
The ability to calculate survivors of an EtO treatment in a similar manner would enable medical industry users of that technology to design, improve, and troubleshoot their sterilization processes and to compare the effects of dissimilar process cycles.
This article describes a research project that was undertaken to achieve that capability. A mathematical model of the inactivation of BI spores by EtO was developed, along with two formulas: a "response" equation for calculating the number of survivors of a sterilization cycle, and a formula for determining the accumulated lethality of exposure to EtO. The response equation was validated using Bacillus subtilis var. niger as the BI.
MODEL DEVELOPMENT
To develop mathematical descriptions of the BI inactivation process that occurs during exposure to EtO, several factors had to be described and their contributions integrated in such a manner that the resulting formulas would be technically rigorous and analogous to that used for thermal inactivation,

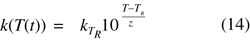
where t is time in minutes, T(t) is temperature as a function of time, z is the temperature (°F) required to reduce the decimal reduction time by 90%, and TR is the reference temperature. For thermal sterilization FO calculations, z is 18°F and TR is 250°F, thus FO is the exposure time at 250°F that will cause the same lethal effect on a BI population as the T(t) temperature regime with z = 18°F.
Development of the formulas for EtO sterilization involved four steps:
Defining lethality under conditions of constant temperature and EtO concentration.
Solving the problem of accommodating transient temperatures and EtO concentrations.
Accounting for the effect of temperature changes on the value of the rate constant (k) using familiar and common sterilization terminology.
Combining the mathematical descriptions of the BI inactivation process into the desired formulas.
|
Figure 1. Inactivation of B. subtilis var. niger spores by EtO at 30% RH and 54°C.7 |
Defining Lethality. Although exposure to EtO affects various macromolecules of bacterial spores, BI inactivation by the gas is attributed to the alkylation of puric bases in the spores' DNA.4 Most of the DNA is not directly involved in the genetic process of synthesizing proteins, so alkylation of other DNA regions may not render the bacteria unable to germinate and grow.5 Relative humidity has also been shown to affect the lethal action of EtO.6
The kinetic model of BI activation that was explored initially in this study can be represented by the differential equation

where N is the number of survivors, t is time, k is the rate constant (which varies for differing process parameters), C is the EtO concentration, and n is an exponent. Fortunately, data on BI inactivation under the conditions of interest for the study (15– 90% RH and 200–1200 mg/L of EtO gas in a hygroscopic or nonhygroscopic carrier) were available.7 Depicted in Figure 1, the published data were used to explore the appropriateness of the kinetic model and to estimate the value of exponent n.
Under conditions of constant temperature and EtO concentration, the response equation for the kinetic model represented by Equation 2 may be written as

where NO is the initial number of survivors. This equation represents a straight line with the slope kCn. In order to calculate the values of the parameters, study participants regressed the digitized data using least squares and inspected the corresponding values for the slope as a function of the EtO concentration.
|
Figure 2. The relationship between EtO concentration and the slope of the semilogarithmic survivorship curves presented in Figure 1. |
Figure 2 presents an example of the linear relationship between the slope of the survivorship curve and EtO concentrations between 200 and 1200 mg/L at 129.2°F (54°C) and 30% RH. In this example, the coefficient of determination (R2) is 0.989; that is, more than 98% of the variation with respect to the mean can be explained by the linear model with an intercept equal to zero. The linearity of the curve implies that the value of the exponent n is 1 or very close to 1.
Based on these findings, if the number of survivors is N, the appropriate kinetic model for the rate of inactivation is represented by the following equation:

Using this model, the response equation when EtO concentration and temperature are kept constant is

This function appears as a straight line in a semilogarithmic scale and describes the experimental data well. Solving this response equation for time yields

Lethality (F) can therefore be defined as the time of exposure to EtO required to achieve a certain inactivation, or

Accommodating Transient Conditions. To describe sterilization cycles where the temperature and/or the EtO concentration change as a function of time, the BI activation process can be divided into small, equal time intervals within each of which the temperature and concentration are assumed to be constant. The survivors after the first time increment (Δt) can then be calculated using the equation

The survivors for the next time increment can then be calculated using

and so on for each time interval. The corresponding results are then added to determine the cumulative effect of exposure to EtO (or other lethal agents with similar kinetic behavior) on the BI spore population. If the time increment chosen is infinitely small, the process can be described by the differential equation

The data used in this study covered the RH interval between 15 and 90%. At higher RH levels the possibility of water condensation increases. The interaction of EtO with such condensation may lead to changes in the gas's concentration and have other effects on the kinetics of BI inactivation. In addition, very dry conditions can significantly change the value of k. Therefore, the equations described in this article may not be applicable to very humid or very dry environments.
|
Figure 3. MathCad work sheet presenting the details of the application of the model to calculate the survivors of a sterilization cycle (page 1 of 3). |
Accounting for the Effects of Temperature Changes. A common term in the sterilization field, decimal reduction time (D) is the number of minutes of exposure to a lethal agent that is required to reduce the spore population by 90% (one log). Its dependence on temperature can be described by the equation

where z is the temperature required to diminish the value of D by 90% and T is temperature. A z value for EtO of 52.92°F (29.4°C) has been reported.8 When z is higher than 50°F, the sensitivity of responses to variations in this value is rather low.
Since kCn is the slope of the lethality curve constructed using the natural logarithm of the survivors, and D is the negative reciprocal of the slope of the lethality curve constructed using decimal logarithms, the relationship among D, k, and C can be expressed by the equation

The corresponding expression for the rate constant k as a function of temperature and z is

Adding a reference temperature (TR) then yields the equation
which accounts for the effect of transient temperatures on the rate constant.
Combining the Mathematical Descriptions. To calculate the number of survivors of a nonconstant lethal treatment as a function of time (N(t)), Equations 7, 10, and 14 can be combined as

The same three equations can also be combined to obtain an expression for the lethality of a process where temperature and EtO concentration vary with time:

In equations 15 and 16, t is time, T(t) is temperature as a function of time, N(t) is the number of survivors as function of time, C(t) is the EtO concentration as a function of time, z is the temperature (°F) required to reduce the decimal reduction time by 90%, I>TR is the reference temperature, R is the reference concentration, and F is the exposure time at TR and CR that would cause the same lethal effect as the T(t) and C(t) temperature regime. These final two equations accurately describe the inactivation of bacterial spores by EtO when RH levels are between 15 and 90%. A minimum of 30% RH is recommended for production sterilization cycles.
|
Figure 4. MathCad work sheet presenting the details of the application of the model to calculate the survivors of a sterilization cycle (page 2 of 3). |
MODEL VALIDATION
Verifying and documenting that the values calculated using the newly derived mathematical model were in close agreement with measured numbers of survivors of EtO sterilization cycles involved two sets of experiments. The initial tests were run in a biological indicator evaluator resistometer (BIER) from Joslyn Valve (Macedon, NY). Both temperature and EtO concentration within the BIER were maintained at nearly constant levels (quasiconstant conditions). The subsequent tests were performed using a two-pallet EtO sterilization chamber and temperature and EtO concentration were varied. In both cases, the temperature and concentration regimes, together with the initial spore population and decimal reduction time of the BI, were input to a MacSoft Inc. (Cambridge, MA) MathCAD work sheet, which calculated the corresponding survivors.
Other equipment and materials used in the tests included a TempTale temperature/humidity sensor from Sensitech (Beverly, MA); a pallet of dummy product; Bacillus subtilis var. niger BIs (106 spores per disk) from NAMSA (Northwood, OH); trypticase soy agar (TSA); sterile pestles, scissors, and tweezers; a vortex, water bath, and biocontainment hood; a 30–35°C incubator; sterile 100- and 150-mm petri dishes; Deca plates, and a 1-ml pipette with sterile tips.
Test Article Preparation. Each of the 10 identical BI disks was put into a glassine envelope. After the envelopes were sealed, they were taped to a master carton. For the tests in a sterilization chamber, this carton was placed on top of the dummy pallet. The temperature/humidity sensor was put in a Tyvek pouch, which was placed on the same carton as the BI units. The decimal reduction time of the BIs was verified per the United States Pharmacopeia.
|
Figure 5. MathCad work sheet presenting the details of the application of the model to calculate the survivors of a sterilization cycle (page 3 of 3). |
Sterilization Parameters. When the production-size sterilizer was used for testing, the dummy pallet and two positive controls were preconditioned for a minimum of 15 hours. After this period, the positive controls were removed and refrigerated until they were needed for comparative testing. The pallet was subjected to a sterilization cycle with a 0.1-minute exposure time and an EtO concentration of 200, 400, or 800 mg/L. Similar procedures were followed in the tests performed using the BIER with the exception that no dummy pallet was used, the concentration of EtO was always approximately 600 mg, and the exposure time was varied between 10 and 21 minutes.
Test Article Retrieval. After the sterilization cycle was completed, the chamber door was opened and the test articles were allowed to aerate in the sterilizer or BIER for 30 to 40 minutes. Using the appropriate safety equipment (respirator, rubber gloves, and lab coat), an operator then removed the BI envelopes from the load and placed them within the biocontainment hood. Next, the operator aseptically removed the BIs from the glassine envelopes, dropped them into an appropriately labeled 10-ml test tube of sterile water (thus creating a 10–1 dilution), and macerated them using sterile Teflon pestles. Continuing to follow aseptic technique, the operator then performed three serial dilutions (to 10–4) using 1-ml aliquots of the test tube solution for each, and plated the results in petri dishes. The remaining solution in the test tube was placed in a Deca plate. Molten TSA was added to each sample and the plates were swirled gently. After the contents had been allowed to solidify, the plates were inverted and placed in the 30°–35°C incubator for a minimum of 72 hours before an enumeration of the surviving spores was performed.
Testing of Positive Controls. The positive controls were treated in the same manner as the BI test articles except that serial dilutions were prepared to 10–5 and the 10–4 and 10–5 dilutions were shocked at 80°–85°C for 10 minutes ± 1 minute. A 10-ml tube containing a calibrated thermometer was used to monitor the temperature. After the operator completed the heat-shock treatment, the positive control tubes were placed in a cold-water bath until they returned to approximately room temperature. Duplicate 1-ml aliquots from the 10–4 and 10–5 dilutions were placed into a petri dish, molten TSA was added to each sample, and the plate was swirled gently. When the contents had solidified, the plate was inverted and placed in the 30°–35°C incubator for a minimum of 72 hours before the spore enumeration was performed. The control tubes and their remaining contents were saved and refrigerated until total counts were confirmed.
Calculation of Survivors. After data on the temperature and pressure of the sterilization chamber and the initial population and decimal reduction time of the BI for each test run had been input to a MathCAD work sheet, the computer program calculated the EtO concentration and the surviving spores corresponding to each minute of the cycle. The calculation of the survivors involved the numerical evaluation of an integral. In order to perform it, the minute-by-minute pressure and temperature data were used as the independent variables of a linear interpolation function (linterp) that calculated the corresponding interpolated survivorship value at the corresponding times during the cycle. Figures 3–5 show sample pages of the work sheet.
RESULTS AND DISCUSSION
|
Figure 6. Comparison of measured and calculated values for the lethal effect of EtO on B. subtilis var. niger using a resistometer. The concentration was 600 mg/L and the temperature 54°C. |
The measured and calculated values for the tests performed in the BIER with quasiconstant temperature and pressure are presented in Figure 6. It is clear from this figure that the two types of values were in close agreement, which verified the accuracy of the BI inactivation model. The corresponding measured and calculated values for the tests run in a production-sized sterilizer under transient temperature and pressure conditions are presented in Table I. Again, the agreement between the corresponding valves was good (within one order of magnitude), although it might be improved by refining the decimal reduction time value used for the calculations (the value on the BI label was used in this study).
CONCLUSION
Two equations have been developed to help users of EtO sterilization technology optimize process cycles. One formula describes the inactivation of BI spores as a function of transient regimes of temperature and EtO concentration; the other describes the accumulated lethality of an EtO sterilization process. Experiments verified that the equations are applicable to processes with RH values between 15 and 90%, enabling users to compare the lethality of dissimilar EtO cycles. The formulas also can be applied to other disinfection processes that exhibit similar kinetic behavior.
Study | Target Concentration | Microbial | Calculated Results |
1 | 200 | 6.2 x 10⁵ | 1.8 x 10⁵ |
2 | 600 | 2.61 x 10² | 33 |
3 | 600 | 84 | 51 |
4 | 800 | 0 | 0.1 |
Table I. Calculated and measured survivor valves for tests run in a production-sized sterilizer under transient conditions. The BI in study 2 came from a different lot than those used in the other test runs. |
REFERENCES
1.AC Rodriguez, "Biological Validation of Thermal Sterilization Processes" (PhD diss., University of Florida, 1987).
2.AC Rodriguez et al., "Population Model of Bacterial Spores for Validation of Dynamic Thermal Processes," Journal of Food Processing Engineering 15 (1992): 1–30.
3.V Sapru et al., "Comparison of Predictive Models for Bacterial Spore Population Responses to Sterilization Temperatures," Journal of Food Science 58 (1993): 223–228.
4.AN Parisi and WE Young, "Sterilization with Ethylene Oxide and Other Gases," in Disinfection, Sterilization and Preservation, ed. SS Block (Philadelphia: Lea & Febiger, 1991), 582.
5.WH Sofer, Introduction to Genetic Engineering (Boston: Butterworth-Heinemann, 1991), 27.
6.AH Dadd et al., "The Influence of Water on the Resistance of Spores to Inactivation by Gaseous Ethylene Oxide," Journal of Applied Bacteriology 58 (1985): 613–621.
7.K Kereluk et al., "Microbiological Aspects of Ethylene Oxide Sterilization," Applied Microbiology 19 (1970): 157–162.
8.TS Liu et al., "Dichlorodifluoromethane–Ethylene Oxide Mixture as a Sterilant at Elevated Temperatures," Food Technology 22 (1968): 86–89.
Copyright ©2001 Medical Device & Diagnostic Industry
About the Author(s)
You May Also Like