Sign up for the QMED & MD+DI Daily newsletter.
Correlating Peel and Burst Tests for Sterile Medical Device Packages
Originally Published MDDI January 2003PACKAGINGCorrelating Peel and Burst Tests for Sterile Medical Device PackagesThe ability to mathematically relate peel and burst test data could allow results to be taken more rapidly to production and quality control personnel.
January 1, 2003
29 Min Read
.svg?width=850&auto=webp&quality=95&format=jpg&disable=upscale "Correlating Peel and Burst Tests for Sterile Medical Device Packages")
The ability to mathematically relate peel and burst test data could allow results to be taken more rapidly to production and quality control personnel.
Peel and burst tests are used by both users and suppliers of pouches to perform incoming and outgoing inspections. They are also used to validate the sealing parameters of a package and as a process control tool. Users and suppliers alike have an interest in clarifying the relationship between peel and burst tests.
Pouch users typically have developed specifications for tensile peel seal strength that are used when testing medical packaging seals. With a model for correlation between peel and burst tests, the faster burst test could be used to update such specifications without requiring an extensive revalidation program. This would make sampling and testing less expensive by reducing labor and material usage costs.
|
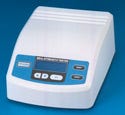
The authors used a Test-A-Pack model 2600 and a pneumatic restraining fixture for burst tests. |
Because pouch suppliers' customers would prefer to use only one package-testing method, suppliers need to demonstrate that the method they use will correlate with the customer's method. Additionally, if the burst and peel tests can be mathematically related, pouch suppliers can use the faster burst test technique to provide peel test values directly to production and quality control personnel. In this way, corrective action can be taken almost immediately to prevent the production of pouches that are out of specification.1 This will increase productivity and, at the same time, reduce labor and material costs.
The authors have developed three mathematical models and a procedure for using them. With these tools, peel seal strength can be calculated from burst data or burst strength from tensile peel strength measurements. In a study of the models, measured strengths were in the range of 1–5% of calculated values. Thus, the authors recommend the procedure as a way to correlate peel tests and burst tests.
The peel and burst tests are the most commonly used methods for measuring the seal strength of peelable flexible packages. The peel test measures the force required to peel apart a 1-in.-wide sample strip cut from the seal material. This test has some disadvantages. It is time-consuming because many strips have to be cut from a package in order to get a true measure of the seal strength. The sample strips may not contain a weak spot that would be present in the pouch. If only a small number of strips from a given package are tested, some substandard seal surface may be overlooked.2
There is some controversy over whether to use peak or average force as a value for seal strength in the peel test. Peak force is the maximum force required to separate the sealed webs, and thus the maximum force created during peeling. Average force is calculated by dividing the energy, which is the area under the force-deformation curve, by the total length of peel. Barcan believes that the average force is a better measure, providing a more comprehensive picture of seal strength, because it considers the entire sample strip of seal and not just an instant during peel.3
There is also some debate regarding how to conduct the test. Testing can be performed using a supported tail or an unsupported tail. According to Earl Hackett, in order to obtain good test repeatability, the peel angle of the two substrates must be maintained throughout the measurement.4 An unsupported peel test, is preferred by others who suggest that it more closely emulates real-world conditions.
The burst test consists of pressurizing a package until it breaks. In pouches with peelable seals, the break typically occurs as a separation of the seal rather than as a rupture in the material. The pressure required to break the package is recorded and interpreted as an indication of the seal strength. The burst test can be performed with or without the use of restraining plates. When plates are used, the deformation of the pressurized package is minimized.
The burst test has gained acceptance in the medical device and medical packaging industries because it is easier to perform and can be completed in less time than the peel test. It also provides an evaluation of the entire package system, not only the seal. By pressurizing the package with air, burst testing subjects the entire sterile package system to typical stresses that the package encounters in the manufacturing, distribution, and use environments.5
Theory
|
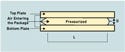
Figure 1. Cross-sectional edge view of pressurized pouch in a restrained burst test. |
Theoretical equations, based on force diagrams, have been developed in order to explain a pouch's behavior during a restrained burst test. In Figure 1, D represents the plate separation, and L is the length of the pouch under test. This dimension is shorter than the restraining plates. The restraining plates apply pressure to the pouch over the contact area (length [L] times width of the pouch [W]).
To find a correlation between peel and burst tests, one must equate a force acting on a surface (burst test) with a force acting on a seal line (peel test). Good agreement was found by Wachala and Yam for paper/plastic pouches and meals-ready-to-eat (MRE) pouches, respectively.2,6 Yam reported that good correlation was obtained for MRE pouches when tensile peel rate was controlled to ensure that it was the same as the rupture (or peel) rate in burst tests.
Yam's theoretical formula (P = 2S/D where P = burst pressure, S = strength, and D = plate separation ) was studied by Feliú-Báez for Tyvek/plastic pouches.7,8 The tensile peeling times were controlled within a range of 1–8% of the burst times. The results showed that the formula P = 2S/D overestimated the actual burst pressure; the overestimation increased at smaller gaps. The overestimation of burst pressure was 22–49% at 0.50-in. plate separation.7
|
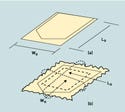
Figure 2. Chevron seal pouch: (a) flat (b) pressurized. |
The formula P = 2S/D does not account for package size. Feliú-Báez found that package size has a significant effect on the restrained burst pressure.8 For that reason, it was hypothesized that the model accuracy could be improved by accounting for the package's dimensions. A force diagram analysis was performed on the entire pouch in order to develop a new model that accounts for package size. Figure 2 (a) shows the original length and width dimensions (LO and WO) of a flat pouch. Figure 2 (b) shows the pouch after it is pressurized in a restrained burst test. The dashed rectangular patch in Figure 2 (b) represents the flat area that is in contact with the restraining plates. The dotted intersecting lines represent the original length, LO, and original width, WO, of the pouch.
|
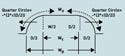
Figure 3. Force diagram of a center section of a restrained pouch with original, contact, and pressurized widths (WO, WC, and WP, respectively). |
Figure 3 illustrates a force diagram of a pressurized pouch. It shows the original width of the pouch, WO; the width of the rectangular patch in contact with the restraining plate, WC; and the width of the pressurized pouch, WP. It is assumed that the unsupported outer border of the pouch deforms into a segment of a circle and that the material does not stretch much.
The original dimensions of the flat pouch are LO and WO. The length and the width of the rectangular patch in contact with the restraining plates are the following:
LC = LO – 2/4(2pD/2) = LO – (pD/2) = LO – 1.571D (1)
WC = WO – 2/4(2pD/2) = WO – (pD/2) = WO – 1.571D (2)
The length and the width of the pouch under pressure, with gap D, are the following:
LP= [LO – (pD/2)] + 2(D/2) = LO – (p/2 – 1) D = LO – 0.571D(3)
WP= [WO – (pD/2)] + 2(D/2) = WO – (p/2 – 1) D = WO – 0.571D(4)
The plate balances the pressure acting on the rectangular patch, and the seal balances the pressure acting on the unsupported perimeter, such that
S [perimeter] = P [working area]
Where working area = total pressurized area – contact area,
S [2(LP + WP)] = P [(LP * WP) – (LC * WC)]
Using Equations 3 and 4 for total pressurized area and perimeter and Equations 1 and 2 for contact area,
P = 2S/D * [(LP + WP) / ( LO + WO c 2.142D)]
P = 2S/D * [(LO + WO – 1.142D) / (LO + WO – 2.142D)] (5)
The term within the square brackets in Equation 5, (LO + WO – 1.142D) / (LO + WO – 2.142D), will be referred to as the correction factor (CF).
The correlation obtained with Equation 5 will not be better than P = 2S/D. Because the CF is a quantity greater than 1, it will predict a higher burst pressure. Thus, it will overestimate even more than P = 2S/D. The fact that the correlation is not better even when the package size is considered suggests that other factors not included in the model can affect it. For example, the model does not account for wrinkles formed in the seal area and the amount of stretch that occurs in pouch materials during a restrained burst test (sometimes called ripple effect). In addition, if the actual geometry of the working area when deformed during a restrained burst test is not semicircular, as assumed in the model, deviations will occur between the actual and predicted burst pressures. All of these factors are difficult to measure and derive with the force diagram analysis.
Because the new model described in Equation 5 did not improve the predictive accuracy, it was decided to use an empirical approach. Multiple-regression analysis was used to fit actual data to a power law model. The following paragraphs provide an explanation of the methodology used and the results obtained.9
Experiment Design
The materials tested in the experiments included a number of peelable pouches from two manufacturers. These were divided in three categories:
Uncoated 1073B Tyvek/polyester poly laminate from supplier A. Sizes tested were 3.25 x 7.25 in., 5.25 x 9.125 in., 7.25 x 11.125 in., 9.25 x 14.125 in., and 11.25 x 15.25 in.
Uncoated 1073B Tyvek/PET/LDPE laminate from supplier B. Sizes tested were 3 x 11.375 in. and 10.625 x 15 in.
Uncoated 1059B Tyvek/polyester poly laminate from supplier A. Sizes tested were 5.75 x 9.125 in. and 9.25 x 14.125 in.
The equipment used in the experiments included the following:
A Test-A-Pack Model 2600 burst tester (Carleton Technologies) with pneumatic open package fixture F100-1600-2 and aluminum restraining fixture (15 x 20 x 0.75 in.) for restrained burst tests.
An Instron Model 4201 Universal Testing Instrument with a 1-kN (200-lb) load cell and an x-y recorder for peel tests.
A stopwatch (±0.001 second resolution) for measuring the burst and peel test completion times at ASTM settings.
Testing Procedures. The pouches were conditioned at ASTM standard test conditions for 48 hours prior to testing. The following procedures were then performed.
A restrained burst test using an open package fixture was performed according to ASTM F1140-96 and ASTM F2054-00.10,11 Parameters under study were the flow index (1, 5, and 9) and plate separation (0.5 and 1.0 in.). The sample size used for each flow-index/plate-separation combination was 10 (n = 10). Therefore, a total of 60 pouches of each material combination were burst tested (3 flow values x 2 plate separations x 10 samples per flow-index/plate-separation combination). Power calculations were used to determine the sensitivity of the experiments when using a sample size of 10.9
|
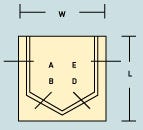
Figure 4. Top view of sample locations in tested pouches. The pouch has the transparent plastic side facing up. |
An unsupported-tail peel test was performed according to ASTM F88-99.12 As shown in Figure 4, 1-in.-wide specimens were cut from the region where the pouch failed during the burst test. The parameters under study were crosshead speed (10 and 12 in./min) and grip separation (1.0 and 2.0 in.). The sample size used for each crosshead-speed/grip-separation combination was 10 (n = 10). Therefore, a total of 40 pouches of each material combination were peel tested (2 crosshead speeds x 2 grip separations x 10 samples per crosshead-speed/grip-separation combination). Power calculations were used to determine the sensitivity of the experiments when using a sample size of 10.9 Peak and average forces were recorded.
Data analysis included both 22 factorial analyses and model validation.
22 Factorial Analyses. As shown in Table I, the factorial experiments had the purpose of determining the effect of flow index and plate separation in the burst test. They also demonstrated the effect of crosshead speed and grip separation in the peel test. All possible combinations of the factors under study were considered.13,14
# | RESPONSE | FACTOR-LEVEL (LOW,HIGH) | COMBINATIONS TESTED |
1 | Burst | Flow Index — 1, 9 | 1, 0.5 in. and 9, 0.5 in. |
2 | Burst | Flow Index — 1, 5 | 1, 0.5 in. and 5, 0.5 in. |
3 | Burst | Flow Index — 5, 9 | 5, 0.5 in. and 9, 0.5 in. |
4 | Peel | Flow Index — 10, 12 in./min | 10, 1.0 in. and 12, 1.0 in. |
22 factorial experiments for burst and peel tests. |
Model Validation. Two approaches were used for model validation—theoretical and empirical. In the theoretical approach, a force diagram analysis produced two theoretical models:8,9
P = 2S/D and
P = 2S/D * [(LO + WO – 1.142D) / (LO +WO – 2.142D)]
The second model is Equation 5. The analysis of these theoretical models consisted of calculating the predicted burst pressure (P) with the two formulas above, and comparing the result with the actual burst values obtained experimentally. A calculation of the percent error also was performed in order to get a numerical comparison.
In the empirical approach, multiple-regression analysis was performed.9 The method was used to fit experimental data to different power law models. The regression parameters, coefficient of determination (R2) and the correlation coefficient (R) were obtained using statistical software. The adequacy of these models was determined by comparing actual values with the predicted ones and by calculating percent error.
Results 22 Factorial Analysis
The analyses of variance performed with the burst test results showed that plate separation had a significant effect on the burst pressure at all the package sizes for each of the material combinations tested. All p values for the analyses equaled 0.000. Additionally, the analyses demonstrated that flow index had a significant effect on the burst pressure when the extreme values, 1 and 9, were used. This was true for all package sizes and each of the material combinations tested. When comparing flow indexes, flow index 5 produced a higher burst pressure in larger packages than did flow index 1. When the comparison was made between flow indexes 5 and 9, the burst pressure tended to show no significant difference.9
The analyses of variance performed with the peel test results showed that the crosshead speed and grip separation did not have a significant effect on either the peak or average peel test results. All p values equaled > 0.050.
Model Validation
Predicting Burst Pressure. Two theoretical models and three empirical models were used to predict the burst pressure from the seal strength values (Table II).
MODEL | TERMS |
Theoretical Model 1: | S = Seal Strength (lb/in.) |
Theoretical Model 2: | S = Seal Strength (lb/in.) |
Empirical Model 1: | X1 = {S/D}*CF (lb/in.2) |
Empirical Model 2: | X1 = {S/D}(lb/in.2) |
Empirical Model 3: | X1 = {S/D}(lb/in.2) |
Table II. Theoretical and empirical burst pressure predicting models. |
The empirical models in Table II are based on the theoretical formulas. The independent variables (X1, X2, and X3) are equal to terms that were derived theoretically with the use of force diagram analysis ((S/D) and CF).9
Regression analysis was performed for the three empirical models. The following four statements summarize the findings:
Lower percent errors were obtained when using average peel force rather than peak peel force in theoretical models for 1073B Tyvek/plastic pouches. Results are shown in Table III.
Slightly better results, in terms of correlation coefficient and average percent errors, were obtained when using average force values rather than peak force in the empirical models. This was true for all material combinations under study. Results are shown in Table III.
As demonstrated in Table III, the empirical models had a lower average percent error than the theoretical ones.
All empirical models provided good results. In general, the first empirical model provided better results than the other two. The first model, which is the closest to physical theory, resulted in slightly higher correlation coefficients. It also tended to have smaller average percent errors, which made it the most accurate. The third model is simpler than models 1 and 2, and it resulted in similar regression parameters for all three material combinations under study.9 This makes it a very attractive model. In addition, the regression parameters are reasonable in magnitude, and the model provided good accuracy, close to that of the first model. Details are included in Table IV.
| AVERAGE PERCENT ERROR | REGRESSION COEFFICIENTS | R |
Model | Peak Force | Average Force | Peak Force |
T1 | 34.66 | 14.40 | — |
T2 | 41.14 | 10.82 | — |
E1 | 5.48 | 5.14 | K = 2.44 |
E2 | 5.53 | 5.27 | K = 1.36 |
E3 | 5.95 | 5.78 | K = 1.53 |
NOTE: T1 and T2 = theoretical models 1 and 2. E1, E2, and E3 = empirical models 1,2, and 3. | |||
Table III. Burst pressure prediction model validation results for supplier A (1073B Tyvek/polyester poly laminate) pouches. |
A summary of the results for all models that predict burst pressure using peak and average seal strength values for supplier A's 1073B Tyvek/polyester poly laminate pouches is shown in Table III. Similar results were obtained for the other two material combinations under study.9
Results for the three empirical models using average values are shown in Table IV, which includes all material combinations tested.9
| SUPPLIER A | SUPPLIER B | SUPPLIER A |
Model | % | Reg. | R |
1 | 5.14 | K = 3.9 | 0.97 |
2 | 5.27 | K = 2.1 | 0.97 |
3 | 5.78 | K = 2.2 | 0.97 |
NOTE: Reg. Coeff. = Regression Coefficient, and R = Correlation Coefficient. | |||
Table IV. Burst pressure empirical prediction model using average seal strength. |
Predicting Seal Strength. The models discussed predict burst pressure (P) when the seal strength (S), the plate separation (D), and the package dimensions (LO and WO) are known. There might be situations in which seal strength (S) must be predicted from burst pressure (P), plate separation (D), and package dimensions (LO and WO). Analysis indicated that this can be done. The two theoretical models were solved for seal strength (S). Two approaches were used for the empirical models: solving for (S) from the burst pressure (P) models, and running a multiple-regression analysis to predict S/D.9 Both methods work.
Data analysis was the same as that used for burst pressure prediction models, and the results were similar. Lower average percent errors were obtained when average forces were used, and the empirical models tended to have a lower average percent error than the theoretical models.
Conclusion
The experiments described revealed that empirical models explained the relationship between peel and burst test results better than theoretical models. The reasons for the disagreement between the actual values and those predicted by the theoretical models are believed to be the following:
The peel test is a uniaxial test in which deformation is evenly applied to a 1-in.-wide strip of seal. The burst test is a multiaxial test in which force is applied by internal air pressure. When the package is pressurized, the seal perimeter does not take the same load at all points because it deforms differently in different areas. Areas that have wrinkles are loose and slack, so they do not take any force; only the stressed part of the perimeter takes the force.7
The theoretical models assume that the material does not stretch much around its perimeter and that the seal area takes on a circular shape. The amount of stretch that the package experiences when pressurized and the actual shape its seal area assumes are both variable and unpredictable. For that reason, those variables are not accounted for in the theoretical model.
Sharp edges, corners, and angles on the package seal can act as stress concentrators during the burst test and affect the results.7
Because both tests are destructive, the correlation is made between the average burst pressure of a group of pouches and the average peel strength of a different group of pouches. For that reason, any variation in the seal strength around the seal perimeter of a pouch, or significant seal-strength variations between pouches, makes the correlation weaker. In addition, the strips cut for the peel test may not represent the point at which the pouch would break in a burst test. Such strips do not necessarily represent either a stress-concentrating deformation or the weakest point in the seal.
The validation results for the empirical models were good. The correlation coefficients were all 0.96 or higher and the average percent errors between actual and predicted values ranged from 1 to 7% for predictions of burst test value from seal strength and vice versa. It should be noted that these results are applicable for the material combinations tested within the range of package sizes tested. Nevertheless, because the independent variables for the empirical models are based on theoretical principles, and the models were run for three different Tyvek/plastic types of pouches, the model should work for other types of Tyvek/plastic combinations. A change in the regression parameters when the materials under study are changed should be expected.
The results obtained when using average values tended to be slightly better than the ones obtained when using peak values. This was anticipated because the average peel force results were less variable than the peak peel force results.
|
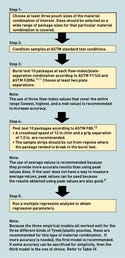
Figure 5. Procedure for a mathematical correlation between peel and burst tests for sterile medical device packages. |
This study resulted in a procedure that can help industry perform a simple experiment for the purpose of estimating the regression coefficients for any particular material combination.9 The recommended procedure is outlined in Figure 5.
When using this procedure to obtain a mathematical model for the correlation between peel and burst tests, the following facts should be kept in mind:
The validity of the model is limited to the range of values covered in the experiment.
Once a model is developed for a particular group of pouches made out of the same materials, it should be revised every time there is a change in the sealing process or in the materials and sealants used.
Since the length, L, and width, W, dimensions of the package are part of the model, it is important to define the way L is used in data analysis. L refers to the distance from the tip of the chevron to the open side of the pouch.
The user can choose whether the regression technique will be employed to predict burst pressure or to predict seal strength. It can be done either way.
REFERENCES
1. DS Barcan and SH Franks, "Comparing Tensile and Inflation Seal-Strength Tests for Medical Pouches," Medical Device & Diagnostic Industry 21, no. 10 (1999): 60–67.
2. TP Wachala, "Correlating Tensile and Burst Test in Pouches," Medical Device & Diagnostic Industry 13, no. 2 (1991): 12–15.
3. DS Barcan, "Using a Seal Matrix to Optimize Package Sealing Variables," Medical Device & Diagnostic Industry 16, no. 9 (1995): 112–122.
4. ET Hackett, "Automated Peel Test for Process Control Eliminates Variables," Packaging Technology and Engineering 7, no. 2 (1998): 44–49.
5. D Bohn, "Using Burst Testing to Evaluate Sterile Blister Packaging," Medical Plastics and Biomaterials 1, no. 1 (1994): 14–20.
6. KL Yam, J Rossen, and X Wu, "Relationship between Seal Strength and Burst Pressure for Pouches," Packaging Technology and Science 6 (1993): 239–244.
7. R Feliú-Baéz, HE Lockhart, and G Burgess, "Correlation of Peel and Burst Test for Pouches," Packaging Technology and Science 14 (2001): 63–69.
8. R Feliú-Baéz, "Analysis and Evaluation of Burst Test Methods Using Restraining Fixtures." Master's thesis, Michigan State University, 1998, 11–20, 37–41, 109–121, and 138–164.
9. R Feliú-Baéz, "Analysis of the Relationship Between Peel and Burst Test for Peelable Flexible Packages." PhD diss., Michigan State University, 2001.
10. ASTM Committee F-2 on Flexible Barrier Materials, ASTM F1140-96: Standard Test Methods for Failure Resistance of Unrestrained and Nonrigid Packages for Medical Applications, (West Conshohocken, PA: American Society for Testing and Materials, 2000), 1176–1179.
11. ASTM Committee F-2 on Flexible Barrier Materials, Draft Proposal ASTM Standard: Standard Test Method for Burst Test Seal Strength Testing of Flexible Packages using Internal Air Pressurization within Restraining Plates, (West Conshohocken, PA: American Society for Testing and Materials, 1997).
12. ASTM Committee F-2 on Flexible Barrier Materials, ASTM F88-99: Standard Test Method for Seal Strength of Flexible Barrier Materials, (West Conshohocken, PA: American Society for Testing and Materials 2000), 989–993.
13. DC Montgomery, Introduction to Statistical Quality Control, 3rd ed. (Hoboken, NJ: Wiley, 1997), 490–491.
14. DC Montgomery, Design and Analysis of Experiments, 3rd ed. (Hoboken, NJ): Wiley, 1991), 216–217 and 607.
Rosamari Feliú-Báez, PhD, is the packaging engineering manager at Glaxo Smith Kline (Cidro, Puerto Rico). Hugh E. Lockhart, PhD, and Gary Burgess, PhD, are professors at the Michigan State University School of Packaging (East Lansing, MI).
Copyright ©2003 Medical Device & Diagnostic Industry
You May Also Like

.png?width=300&auto=webp&quality=80&disable=upscale)