Analytics: The Key to Modern Medical Device Manufacturing
Flex Design Engineer, Ivano Lazzaroni explains how the design of Experiment (DoE) can help define and optimize assembly process parameters for complex medical device designs.
July 25, 2022

![IL_Profile_Grey-BG[45].jpg IL_Profile_Grey-BG[45].jpg](https://eu-images.contentstack.com/v3/assets/blt14ac89070d5e4751/bltec2ca1118f40a691/655c1078602be9040a31fed3/IL_Profile_Grey-BG_5B45_5D.jpg?width=200&auto=webp&quality=80&disable=upscale)
Ivano Lazzaroni, Flex Design Engineer
In the last few years there has been a dramatic increase in the variety and volume of consumer electronic devices. Lower cost, more availability, ease of use and compelling new features like connectivity and storage are set to drive the market to over one Trillion USD by 2027 according to a recent report by Fortune Business Insights. That’s a predicted growth of $300 billion from 2020 levels.
The rapid evolution of portable electronic devices like mobile phones has primed consumers to expect frequent feature enhancements and regular technical advances in other devices. A high bar for device manufacturers to sustain.
As the pace of technological change quickens, and feature packed devices become smaller, manufacturers face ever-more complex assembly processes. This is especially true for medical device makers.
A reliance on a process engineer’s expertise is no longer enough to meet long-term reliability and performance objectives. Today, we must also use analytical methods to ensure consistent production quality, and accurately predict future device performance. Better analysis helps us speed the process between design and manufacturing to meet those all-important time-to-market expectations of consumers and patients.
One of the most useful and proven approaches we take at Flex is based on a structured and analytical method called ‘design of experiment’ or DoE.
This approach means that we study and validate the relationship between multiple process input variables and key output variables, in a structured way to swiftly identify the optimal point at which the process outputs (within margins) satisfy the product requirements and remain stable over time.
This DoE approach brings considerable advantages over traditional methods like ‘one variable at a time’ (OVAT) or ‘trial and error, and is even more valid when there are complex or challenging design requirements.
In the example below, we will examine how DoE was performed for an ultrasonic welding on an external shell of a small circular object made in polyoxymethylene (POM). The design does not allow for flashes of molten material (cosmetic restriction) and requires high mechanical strength.
The design has a double V-joint shape, thin walls and no containment for the material melted during the process (see. Fig.1). In our example, all the analysis has been done with support of minitab software.
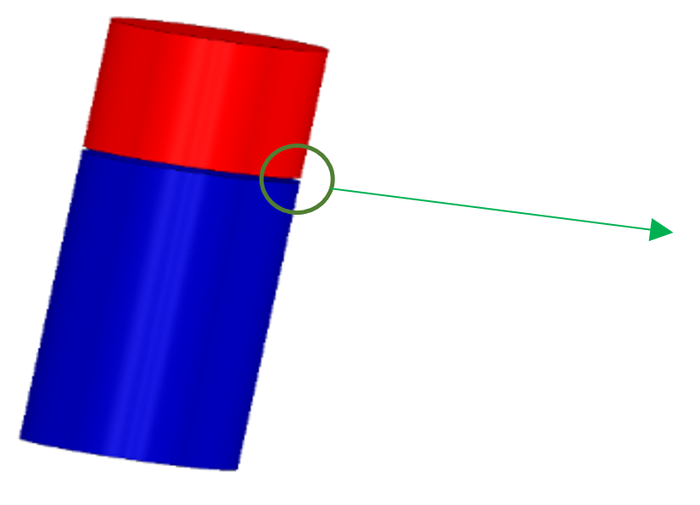
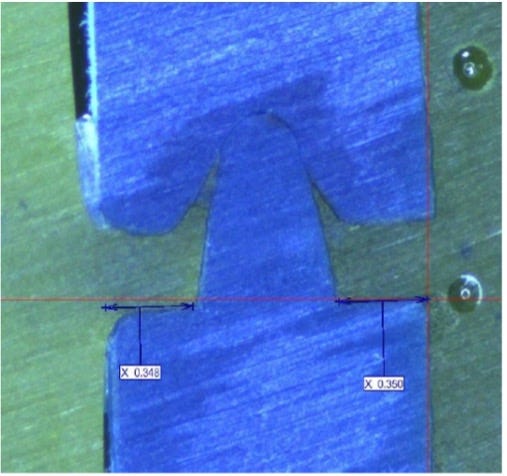
Fig.1 Design details: simplified overview or the product and cross-section of the welding area
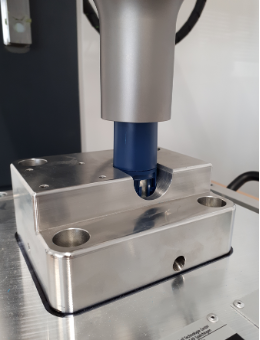
Fig.2 Principle of the Ultrasonic Welding technology of plastics: Bottom part is kept in a stable position on a nest, not free to move. Top part is placed on top, free to move vertically. A titanium (or aluminium) horn engages the upper part and combination of pressure and ultrasonic vibrations heat the material in contact between top and bottom halves, welding the parts together
Planning
The execution of a DoE, as described in this article, goes through three main phases, each of them has its own specific purpose and target:
Planning: in which the process map and test plan are engineered.
Screening: where we begin to understand how the process works and identify the key parameters to be controlled.
Modelling: where the optimal working point is found, and process margins are verified.
In the planning phase we build a map of the process by fixing the acceptance criteria as reference for the optimization of the working parameters. We also sort and evaluate all the possible input variables that could influence the process outputs. These are ranked in order of likely impact.
Spending an appropriate amount of time at this phase greatly reduces the risk that we will have to repeat the DoE because of unsatisfactory results. And this in turn, saves cost and time of producing and using multiple parts.
We begin by brainstorming all the possible factors (machine settings, fixtures, component quality etc.), and then rank them based on their importance, how much we already know about their impact, and the ease of being modified during the execution of the DoE.
Changing the frequency of the welder, for example, would require different equipment with a different converter and would be difficult to implement.
The final ranking defines the priority and guides the choice of variables to be tested in the DoE.
In our example the requirements meant there could be no process flashes and the unit needed to have a high mechanical strength. Both outputs were equal in importance. When using ultrasonic welding to join plastic parts, the most critical aspect to be assessed to allow a repeatable process are:
vibrating amplitude;
correct interface between parts (how the components are initially touching each other, and the force applied to them);
the energy used during the process;
the permeation of the melted material after welding.
At the end of the brainstorming session, we decided to include in the DoE the following factors:
All the inputs that can be set by machine;
components built with different molding parameters (to simulate batch-to-batch variations);
alignments between parts, fixtures, and machine.
Fig.3 shows how the planning was handled.
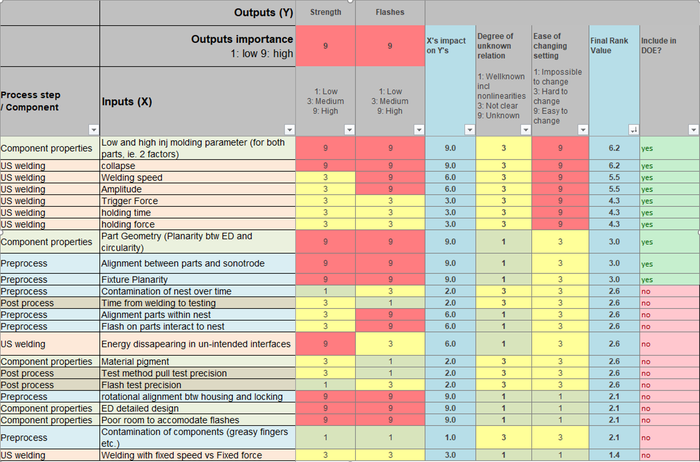
Fig.3 Ranking table
The next step is to define which of the inputs are fixed, and therefore can be verified just once as pre-requisites before starting the DoE; and which inputs are variable, and therefore have to be assessed and measured during the DoE.
We are now ready to map the DoE and start building the factorial plan in detail. Fig.4 groups all our decisions into a diagram and, as we can see, includes variable and fixed inputs as well as our acceptance criteria (process requirements) used to measure the DoE.
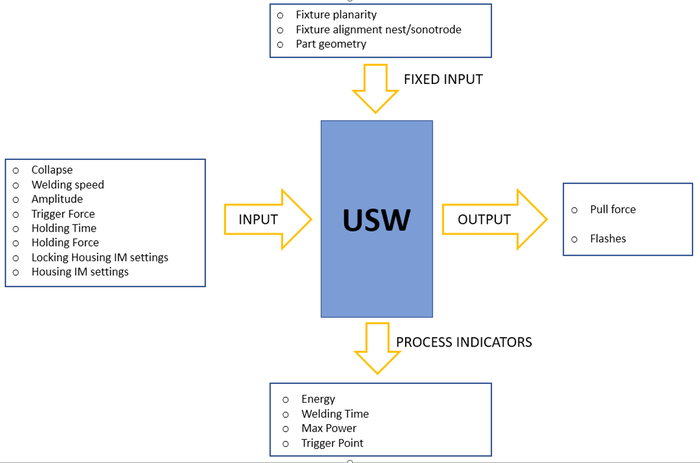
Fig.4 Process mapping
Screening
Looking at the design for the first time, as in our example, offers a range of variables to analyze and we will only have a vague idea of the optimal configuration. This post-planning phase called screening helps us identify the critical factors (process inputs), that have a direct influence on the responses (outputs).
Screening also helps us understand how to reduce the range of levels to be used in a third phase of the DoE, called modelling, the phase that later will lead us to the final process parameters configuration.
Before screening, it is important to identify and set levels for each factor to be tested. Levels for screening must be set to produce evident variations in the responses, including out-of-specification results.
The last step before making samples, along with consideration of parts availability, is to finalize the factorial plan.
A full factorial DoE, with numerous replicas and multiple factors to check
would be too time consuming and require too many parts. A benefit of software like Minitab is that it can support us planning our DoE by reducing the number of runs, and simultaneously preserve the reliability of the data.
Once the plan is fixed, and all samples have been produced and measured against the established acceptance criteria, the results are analyzed through Pareto Chart and Main Effect Plot (Fig.5 and Fig.6).

Fig.5 Pareto Chart and Main Effects Plot for Pull Force

Fig.6 Pareto Chart and Main Effects Plot for Flashes
The screening phase helped us to understand which factors are relevant and which not, like for example the Holding Time and the Holding Force. As we can see from the graphs, these factors have no effect on the process outputs as they don’t present great variability in the Main effect plots. This is confirmed in the pareto with neither factor appear as statistically significant.
For these kinds of factors, we can select fixed values, based on what we consider to be the best performance level for the process, without expecting a process drift in the future.
The graphs also show that the variations introduced by the batch-to-batch variation is negligible.
The main effect plots have also confirmed the challenging nature of our requirements, which clearly contrast with one another. We can see this in the analysis of the collapse, for example. By increasing it, we can increase the welding force, but we also increase the presence of flashes. Therefore, we need to find the right balance.
The pull force has been measured with a custom fixture at the tensile tester (Fig.8), while flashes have been checked with an x-ray machine (Fig.7) and ranked as follow:
0 = absence of flashes;
1 = flash size within the external surface of the part;
2 = flash size slightly exceeding the external surface of the part;
3 = flash size highly exceeding the external surface of the part.

Fig.7 Flash ranking based on X-Ray images
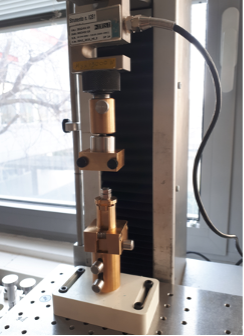
Fig.8 Setup used for testing the welding strength (pull force): the two ends of the welded sub-assembly are fastened on the two sides of the fixtures; one screwed on the tensile base and the other screwed to the load cell. The welded sub-assembly is pulled until the welding breaks, providing the strength of the joint
This preliminary analysis gives us the opportunity to carry out a further DoE where we only consider the parameters that significantly impact the process. In our example, those factors are Collapse, Speed, Amplitude and Trigger Force. Further exploration of this subset increases our confidence that the design requirements will be met. We can now enter the last phase, modelling.
Modelling
In this third and final phase, our goal is to find the optimal working point. This is done by repeating the DoE process, as before, but this time only including the most significant factors as identified in the screening process, with a more granular focus on levels. For example, when analyzing the collapse, there is no reason to perform the test again at 0,10mm which gives a very low pull force. Instead, we can explore values closer to 0,16mm, where we start to see a plateau in the welding strength.
The new levels to be tested are chosen based on the analysis of the Main Effects Plots during the screening phase. With just few additional samples welded, we can confirm or reject our assumptions.
Minitab once again helps us to define the factorial plan by optimizing the runs based on the availability of parts and then, as in the previous phase,
As in the previous phase, we can use Minitab to optimize the factorial plan and to analyze the samples produced against the acceptance criteria of Pull force and flashes, again through Pareto Chart and Main Effects Plot.
The analytical approach is the same as before, but this time our goal is different: to identify the set of process parameters to meet all the product requirements (responses).
Beside the above-mentioned graphs, through the “response optimizer” in Minitab, we can easily see the predicted values of Pull force (or Flashes), based on different process parameters, so that we can define the optimal set.
In our example, with the set targets of maximization of the Pull Force and absence of flashes, the response optimizer predicted that, with the suggested parameters in red (a collapse of 0,14mm, a welding speed of 4mm/s speed, an amplitude of 90% and a trigger force of 40N) we can expect to have a process that produces flashes-free samples with a pull force around 833N (see Fig.9). The response optimizer also gives a quick overview of what are the levels of Pull and Flashes in case of High and Low tolerance, just moving the red lines to different input values
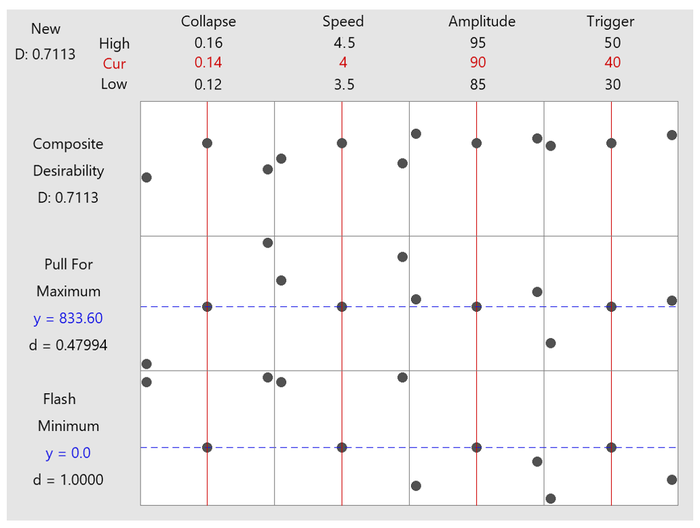
Fig.9 Response Optimizer results
Finally, we must verify our working point assumptions and check process capability to ensure we reach the expected level of quality over time.
This is done through a cpk analysis on a sample size which is set based on the method we are using to measure the requirement (attributive requirement needs more samples than a continuous one), and on the level of confidence.
The usual target is to have a Cpk>1.33 even if sometimes, depending on the analysis of risk, it is required to reach higher levels.
Conclusion
In any business, success is based on your ability to meet, and exceed, the needs and expectations of your customers. The medical world is no different. Time to market, product cost and quality and minimal recalls are the criteria for success.
A Design of Experiment, performed as described, will become an ally to process engineers that helps them quickly achieve the desired result and, if needed, to promptly react to any inconvenience, mitigating delays or additional costs.
With increasing pressure to do more, in less time and more accurately, analytical methods are necessary to ensure consistent production quality, and future device performance. This approach shortens the time between design and manufacturing to help you meet and exceed customer expectations.
About the Author(s)
You May Also Like

.png?width=300&auto=webp&quality=80&disable=upscale)
