Sample Size Selection Using a Margin of Error Approach
COVER STORY: PACKAGING
|
Manufacturers must employ sample sizes that ensure that packaging |
The rise in nosocomial (hospital-acquired) infections in recent years has brought attention from epidemiologists, microbiologists, healthcare professionals, government officials, and the media. Handling procedures, hospital hygiene practices, and even the genetics of the microbes have all been scrutinized.
The Centers for Disease Control and Prevention (CDC) indicate that a number of microbes have been implicated as causing nosocomial infections through the years.1 The microbes responsible for these infections include the following:
• Staphylococcus aureus.
• Enterobacteriaceae.
• Pseudomonas aeruginosa.
• Klebsiella pneumoniae.
|
Figure 1. (click to enlarge) Resistance of vancomycin-resistant Enterococci among ICU patients, 1995–2004. Source: NNIS. |
CDC also suggests that increases in nosocomial infections can be linked with the organisms becoming more resistant to both processes and drugs that are intended to kill them. Figures 1–4, which consist of data collected by the National Nosocomial Infections Surveillance System (NNIS) and published by CDC, depict the increasing antimicrobial resistance of specific strains of various microbes over time.
|
Figure 2. (click to enlarge) Resistance of fluoroquinolone-resistant Pseudomonas aeruginosa among ICU patients, 1995–2004. Source: NNIS. |
The most likely source of nosocomial infections relates to handling and hygiene procedures of the healthcare providers and hospitals. Nevertheless, judicious device manufacturers are doing their part to ensure that device packages and their contents do not contribute to increasing infection rates. As a result, the integrity testing of medical device packaging is of escalating importance.
Medical device manufacturers are required to package devices so that they withstand “the rigors of shipping and arrive at the point of use in a safe and functional condition.”2 Additionally, they must employ testing protocols that provide objective evidence that the process will produce an expected outcome. These protocols give manufacturers a “high degree of assurance” that their packages will maintain integrity from the sterilization process until the product is delivered to the patient.
|
Figure 3. (click to enlarge) Resistance of third-generation cephalosporin-resistant Kliebsiella pneumoniae among ICU patients, 1995–2004. Source: NNIS. |
At the same time, the industry faces immense pressures regarding the cost of healthcare. Providers, patients, insurance companies, and government officials all indicate that reducing the cost of healthcare is a major priority. In sum, the device industry faces an increasing level of expectation that must be delivered at a reduced cost.
|
Figure 4. (click to enlarge) Resistance of Methicillin (oxacillin)-resistant Staphylococcus aureus (MRSA) among ICU patients, 1995–2004. Source: NNIS. |
Consequently, choosing the appropriate sample size and testing protocols to validate the processes can be a daunting task. A sensible approach includes considering risks and understanding the ramifications associated with choosing too many or too few samples.
Risk Considerations in Qualifying Sterile Medical Packaging
The Risk of Being Too Risk Averse. It is important to bring package-product systems to market that ensure patient safety, meet all legal and regulatory requirements, and maintain product sterility. However, the costs associated with being too conservative are often overlooked.
When a manufacturer employs an excessive level of test severity or conservatism, the consequences can delay the introduction of an otherwise beneficial device. Such a delay means that superior treatments are not available as quickly as possible. An overly cautious approach can also yield excessive waste and increased disposal costs, both of which are associated with overpackaging. Additionally, although it is seldom considered, unwarranted and excessively high standards result in loss of opportunities to reduce the cost of healthcare.
The Risk of Being Too Risky. The costs associated with being too risky are, perhaps, more obvious than those associated with a more conservative approach. Bringing a product to market that has not received thorough package testing is asking for problems. The biggest concern is patient harm. Many patients who need medical devices and hospitalization are already compromised in terms of overall heath. For some patients, such as those on immunosuppressive therapy, the contamination of a device with even one colony-forming unit (CFU) may eventually be life threatening.
Apart from the obvious concerns regarding patient risk, inadequate package testing employing too few samples can lead to product recalls, damage to company reputation, lawsuits, increased FDA scrutiny, and decreased stock prices. Within the hospital, questionable products can lead to delays in the operating room and a lack of confidence in the product. All of these outcomes are highly undesirable.
The Benefit of Appropriate Risk Taking. Although the quality system regulation (QSR), 21 CFR 820, does not require a specific risk management system, it does require risk analysis “where appropriate” in design validation, which is typically where package integrity testing would occur. ISO 14971 is recognized by FDA as a system that employs risk-based decision making and an analysis of potential risks associated with an unexpected outcome.3 This standard provides a framework for establishing that a device will be safe and effective as well as meet end-user requirements. It provides an excellent structure for analyzing risk.
Through careful consideration of risk, including cost and benefit, positive outcomes can be maximized, and undesirable consequences minimized. Balancing these issues comes into focus in choosing an appropriate sample size when validating your processes. Important factors to be considered when determining an appropriate sample size include the possible risks associated with a given failure, the likelihood of the failure, relevant consequences associated with the failure, and any relevant sterile barrier system history.
Current Approaches to the Selection of Sample Size
|
When choosing sample sizes, it is important to consider the type of packaging being tested, as well as issues such as sterile barrier system history. Photo courtesy of Oliver Medical (Grand Rapids, MI). |
The QSR dictates that manufacturers establish methods and controls (i.e., a quality system) to ensure that processes are validated “with a high degree of assurance.” This regulation applies to packaging processes and, consequently, to the integrity of packages. However, FDA does not dictate what type of program needs to be implemented. There is no mention of an acceptable quality level (AQL) in current government documents. The agency does not dictate how many packages should be subjected to simulated distribution testing to ensure that packages meet all functional requirements. Instead, FDA broadly defines what must be done, leaving details (such as what constitutes a high degree of assurance) up to device manufacturers.
Therefore, manufacturers of medical devices use a variety of techniques to determine suitable sample sizes. Some techniques are appropriate, while others are not.
Inappropriate Techniques. Anyone who has ever worked in a production facility, medical device R&D group, or other corporate function has heard the phrase, “because that is how we have always done it.” Although this may work for some decisions, like where to host a company picnic, it is not a sound defense of a sample size. Sample-size justifications that have been inherited in this way may reflect historical judgments made years before the broad application of statistical methods and statistical process control.
An equally inappropriate technique for determining appropriate sample sizes is to arbitrarily pick a number. Arbitrarily picked sizes tend, for some reason, to be round numbers, such as n = 10 or n = 30. Thirty is a particularly interesting case, as many people believe it to be the magical, statistically valid sample size.
However, the magic of this myth is easily dispelled. Consider a lot of 50 units; by sampling n = 30, 60% of the total population produced has been sampled. If the sample were pulled appropriately (i.e., throughout the run), and the process were in control, some reasonable assumptions can be made about the portion of the population that was not sampled. But now consider sampling n = 30 in a lot of 2 million units. Using n = 30 would represent 0.0015% of the total population produced. Arbitrarily choosing 30, without context, such as considering lot size or risk factors associated with a failure, is not a sound approach.
|
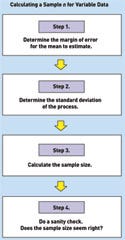
Figure 5. (click to enlarge) A simplified guide to calculating a sample size for variable data. Source: NIST. |
Another way of dispelling the n = 30 approach is to determine what confidence is obtained if a sample size of 30 is used for pass-fail data. By quick calculation, if a target defect rate of no more than 1% is needed, but a sample size of 30 is used, the detectable difference will be 3.5% (see Figures 5 and 6). That would mean that in any typical production batch, 3 out of 100 might be nonsterile.
|
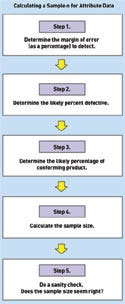
Figure 6. (click to enlarge) A simplified guide to calculating a sample size for attribute data. Source: NIST. |
A different approach is to examine resulting confidence intervals. The exact one-sided upper 90% confidence limit for a population rate based on observing no failures in a random sample of 30 is 0.0738. Therefore, seeing no failures in 30 does not rule out a population or production percentage of up to 7.38% at 90% confidence. Clearly, one out of every 14 products having a defect would be outrageous. Nevertheless, if inadequate sample sizes are selected for pass-fail data, huge risks may be undertaken by unknowing companies.
Finally, in some circumstances, uninformed companies may limit sample sizes based on the assumption that producing and testing units would be too expensive. Although the economics of any product development initiative must be thoroughly understood, the cost of testing a robust sample size is often not properly weighed against the cost of not testing. The effect to the company of just one inaccurate conclusion that compromises the integrity of a sterile barrier system and results in a recall or harms a patient far surpasses the incremental costs of testing additional units.
Appropriate Techniques. Most appropriate techniques for choosing sample sizes are based on statistical approaches, some of which are outlined below.
Previously Published Sampling Plans. Perhaps the most common way companies approach the development of a sampling plan is by relying on plans that have been created by others. One of the most ubiquitous sampling plans is MIL-STD 105E, which is a sampling plan for attribute data. It later became ANSI/ASQC Z1.4–2003, “Sampling Procedures and Tables for Inspection by Attributes—E-Standard.” Sampling plans like these are appropriate for processes that have been shown to be stable and capable.
However, a note of caution is in order. The proper sampling plan must be selected based on whether the data are attribute or variable. Attribute data are also called binary data, meaning that they provide pass-fail information and nothing more. They are converted to discrete data by counting the number of passes or fails. Variable data, on the other hand, are measured on a continuous scale. The weight of a product, for instance, is an example of variable data.
Regardless of the type of data, using plans like the MIL-STD generally requires an AQL. An AQL is user defined. In other words, customers determine the acceptable level of product quality, or the numbers of failures they are willing to accept and still deem the incoming product as acceptable. Although consumers may be willing to accept a specified number of failing widgets, it is unlikely that healthcare providers or immunocompromised patients would provide manufacturers with any level of allowable defects.
Statistically Determining Your Own Sample Size. Another sound statistical approach is for companies to determine their own sample size, based on confidence intervals. This is not as difficult as it sounds. The confidence level required will be chosen based on an understanding of the risks associated with a failure, the history of the product, the likelihood of a failure, etc. The greater the level of confidence needed, the larger the number of samples required, and the more certainty exists regarding the population being produced.
Sample size can be calculated for both attribute and variable data (see Figures 5 and 6). These calculations require manufacturers to have examined, and challenged, their processes to understand the inherent variability. This variability is reflected in the standard deviation, which is one of the numbers required for the calculation. Obtaining standard deviation from multiple runs across several lots of material is strongly recommended as this is a more realistic setup for your process. The larger the standard deviation of a process, the larger the sample required to have a smaller margin of error.
Two separate groups of statistics are available to help determine an appropriate sample size: statistics that assist with estimation, and statistics that are used in hypothesis testing. Estimation is concerned with a margin of error. In hypothesis testing, more-advanced statistics are used to prove whether there is a difference between two treatments. This article utilizes the estimate approach and is concerned only with margin of error. A future article will deal with exact methods and hypothesis testing, including an understanding of the power associated with a given sample size.
Most people are familiar with the term margin of error, as it is often used during political campaign seasons when polls are taken regarding candidates' likelihood of receiving votes. The more formal, statistical definition of margin of error is one-half of the width of a confidence interval. An example would be a preelection poll that questioned people regarding their voting preference. If pollsters wanted to create a 95% confidence interval that was 4 percentage points wide from the results, they would be need a sample size associated with a margin of error of 2%.
Calculating a Sample Size
The National Institute of Standards and Technology (NIST) provides an online statistics reference that covers this simple approach to calculating sample sizes (see Figures 5 and 6).4 There are different approaches for calculating a sample size for variable data and for attribute data.
Variable Data. Calculating a sample size for variable data follows four steps.
Step 1. Determine the margin of error in sample populations that needs to be seen. Being able to detect small margins of error will require larger samples. As a result, an informed decision needs to be made regarding what the target value is and what the acceptable tolerance is on either side of that target.
For example, could you live with a seal strength result that is ±1 lb of force? Probably not, if the target is 1.5 lb and the acceptable range is 0.5 for keeping the product contained within the package and 4 lb for being able to pull the package open at the hospital. A more-realistic margin of error might be ±0.2 lb.
Step 2. Determine the standard deviation. The easiest way of finding the standard deviation is by looking at some historical data. Prudent manufacturers will consider that real life presents variations in the materials, shifts, operators, plant temperatures, etc. The standard deviation should reflect the changes that will occur during the course of a normal run. This type of analysis of the performance of a system yields valuable information regarding how tightly processes are controlled.
Step 3. Crunch the numbers using the NIST equation

where stdev is the standard deviation. The degree of confidence should reflect the judgment of the manufacturer. Device manufacturers will consider the risk associated with product failure, the history of the device, the characteristics of the device and package, the likelihood of a failure, etc., when determining the appropriate confidence bound. It is important to note that the 1.96 in the equation provides for a 95% confidence bound. If a 90% confidence bound is preferred, use 1.645 instead. In addition, there is an assumption that the sample mean is normally distributed. The sample mean should be tested using any one of a number of tests to ensure that the normal probability assumption has been met before proceeding with this approach.
So, using the earlier example, the equation would be

which would yield n = 8.64.
Step 4. Do a sanity check. Does this sample size, intuitively, seem right? Is it likely to produce the required outcomes?
Attribute Data. Calculating a sample size for attribute data follows five steps.
Step 1. Determine the margin of error that needs to be detected, as a percentage. The margin of error represents the sensitivity of the statistical technique's ability to estimate differences in samples' values. To estimate small differences in a population, a larger sample is needed. Extremely variable processes will require even larger samples.
For example, would device manufacturers be satisfied knowing that they were within ±2% of a target percent defective? Usually not. A more likely d would be 0.5%, or 0.005.
Step 2. Determine the likely percent defective, q. For example, to know that there are less than 1% defective would require that q = 0.01.
Step 3. Determine the likely percentage of conforming product, p. This is simple, because p = 1.0 – q. If q = 0.01, then p = 0.99.
Step 4. Crunch the numbers using the NIST equation,

where d is the margin of error, in percent; q is the percent defective; and p is the percent conforming. Therefore,

which makes n = 1521.27. Always round the result up; in this case, the sample size would be 1522.
Step 5. Do a sanity check. Does this sample size, intuitively, seem right? Is it likely to produce the required outcomes?
The high sample size of 1522 might be surprise some people. However, consider the amount of information that is provided in a pass-fail test. Each sample unit provides only one small piece of information. This is in stark contrast with the amount of information provided by each trial of an experiment that provides variable data. Each data point not only provides information regarding its own value, but it also provides information on how far away it is from the average value, whether it is away from the mean in a positive or negative direction, and what the expected variation may be for other samples.
The calculations for attribute sample sizes require product lots to be somewhat large. The statistical requirement is that n × p > 5 and also that n(1 – p) > 5. Entering different values for p shows that the smaller the percent defective, the larger the sample size must be for these statistical approaches to remain valid.
Conclusion
Companies can either use a previously published plan, such as ANSI/ASQC Z1.4, or create their own based on a fundamental understanding of statistical principles to choose sample sizes. But regardless of the method chosen, a company's processes must be under control for a plan to work properly.
Judicious manufacturers recognize that they need to make informed, defensible decisions regarding their sample sizes. However, informed decisions are impossible in an information vacuum. Techniques presented in this article can not only provide insight into calculating appropriate sample sizes for validation; they also show that manufacturers must begin to develop an understanding of their process variability and consider myriad other factors when choosing an appropriate sample size.
Acknowledgment
The substance, recommendations, and views set forth in this article are not intended as specific advice or direction to medical device manufacturers and packagers, but rather are for discussion purposes only. Medical device manufacturers and packagers should address any questions to their own packaging experts and have an independent obligation to ascertain and ensure their own compliance with all applicable laws, regulations, industry standards, and requirements, as well as their own internal requirements.
Nick Fotis is director of packaging for Cardinal Health (McGaw Park, IL) and can be contacted at [email protected] . Laura Bix is as assistant professor at the Michigan State University School of Packaging. E-mail her at [email protected].
Resources
1. Robert A Weinstein, Centers for Disease Control and Prevention, “Nosocomial Infection Update,” Emerging Infectious Diseases 4, no. 3 [online] July–September 1998 [cited 29 June 2006]; available from Internet: www.cdc.gov/ncidod/eid/vol4no3/weinstein.htm.
2. John Spitzley, “The State of Sterile Package Integrity Testing in the Medical Device Industry,” in WorldPak Proceedings, (East Lansing, MI: Michigan State University, 2002).
3. ISO 14971:2000, “Medical Devices—Application of Risk Management to Medical Devices” (Geneva: International Organization for Standardization, 2000).
4. National Institute of Standards and Technology, “Selecting Sample Sizes,” Engineering Statistics Handbook [online] (Gaithersburg, MD: National Institute of Standards and Technology) [cited 29 June 2006]; available from Internet: www.itl.nist.gov/div898/handbook/ppc/section3/ppc333.htm.
Copyright ©2006 Medical Device & Diagnostic Industry
About the Author(s)
You May Also Like





.png?width=300&auto=webp&quality=80&disable=upscale)
