A Structured Approach to Rapid Process Development and Control
Medical Device & Diagnostic Industry MagazineMDDI Article IndexOriginally Published January 2000PROCESS CONTROLThe use of a structured development plan helps companies integrate statistical and analytical methodologies to optimize process gains faster.
January 1, 2000
Medical Device & Diagnostic Industry Magazine
MDDI Article Index
Originally Published January 2000
The use of a structured development plan helps companies integrate statistical and analytical methodologies to optimize process gains faster.
Research and development, technology transfer, and manufacturing departments may go by different names, but all three functions are involved in the development of a new process or the improvement of an existing one. The "smarter" companies develop a process up front to eliminate virtual walls between departments. Nonetheless, it is still common to find a process that has been developed in R&D and cleanly transferred to manufacturing after a product has passed clinical trials or obtained premarket notification (510(k)) clearance. The belief is that the manufacturing team has all the information necessary to make the process work; however, if this is not the case, manufacturing gets penalized for not meeting expected yields or for experiencing excessive rejects and/or negative labor variance.
Following a structured development plan is the best way to ensure that process development activities consistently employ the best methods available. It is also important to document the rationale, data, and results of such a plan. A structured plan can comprise statistical tools, analytical methods, and engineering or scientific judgment. Clearly, statistical and quality tools provide a high degree of confidence and confer the optimum robustness to a process.
Today, all device companies employ the same basic statistical concepts; however, as Kim and Larsen pointed out in their article, "Improving Quality with Integrated Statistical Tools," "the function [of statistical tools] is commonly limited to basic training in statistical process control (SPC) for manufacturing employees and to the use of control charts and inspection sampling programs in key manufacturing processes. Such limited strategies rarely result in widespread or effective use of statistical tools."1
These tools are often used in a disjointed, ad hoc manner. Because of this lack of integration, the benefits of using the information generated by one tool as the input or foundation for any downstream analysis are not realized. Also, the use of different statistical approaches in an inconsistent manner can generate contradictory results.
These issues can be addressed by using a simple and straightforward methodology, such as the one presented in this article. The methodology described here emphasizes a structured approach to process development with a view to integrating statistical and analytical tools and techniques.
DEFINING UNIT OPERATIONS
A typical process is made up of a series of unit operations. Figure 1 illustrates a simple process for manufacturing. A unit operation is a discrete activity—such as blending, extrusion, injection molding, or sonic welding—with its own set of inputs, set points, and outputs. Assembly could also be a unit operation.
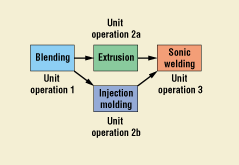 Figure 1. Typical process flow.
The unit operations are selected and developed during the development stage, at which time it is critical to obtain as complete an understanding of the process as is economically feasible. This is accomplished through process characterization, which implies a detailed knowledge of the inputs and outputs of a process including the set points and tolerances. Too often, process characterization is left for manufacturing to perform, at which point the purpose of the exercise is to control poor quality rather than design the process to achieve the desired quality.
DEFINING INPUTS AND OUTPUTS OF EACH UNIT OPERATION
A unit operation is composed of inputs and outputs (Figure 2). In some cases, the inputs may be some or all of the actual outputs of an upstream process, or they may include external parameters, such as ambient humidity. Adjustable parameters are those settings of a particular unit operation that can be modified, such as the dwell time and pressure applied during a sonic welding operation. Each unit operation results in outgoing characteristics— for example, the strength or flow rate through a seal. These outgoing characteristics may then become inputs to one or more of the downstream unit operations.
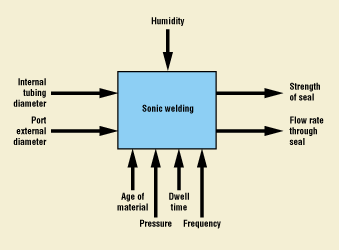
Figure 2. Inputs and outputs of a typical unit operation.
Identifying the parameters and characteristics—generally referred to as elements—is an important step in the process development cycle. Several methods can be used to identify these elements, including cause-and-effect diagrams (Figure 3), fault-tree analysis, open brainstorming, and quality function deployment.
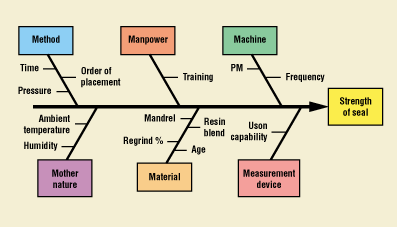
Figure 3. Typical cause-and-effect diagram.
Once the parameters (inputs) and characteristics (outputs) of a unit operation have been determined, it is necessary to identify their upper and lower set points and target values. During the early stages of developing a new process, the starting point for identifying these set points and target values will be based on scientific judgment that is either confirmed or revised with empirical data.
MEASUREMENT CAPABILITY ANALYSIS
Calibration of gauges is a basic requirement, but it only corrects the devices' bias and accuracy. One must also determine if the measuring device and method are repeatable and reproducible. Often, an evaluation of a measurement system should be performed using a gauge repeatability and reproducibility (gauge R&R) study or similar method, which is usually sufficient.2 Repeatability is how well a measurement gauge repeats the measurement of a part whereas reproducibility is the variation observed when more than one person measures a single part (Figure 4). This is quite a significant concept, because typically during design and development there is either one person or a designated group of highly trained engineers and scientists who conduct the measurements. These measurements may have a high degree of reproducibility, but the large number of operators conducting the measurements in a full-scale manufacturing environment may not be able to reproduce the same results as the highly trained engineers. Therefore, the design team should select a measurement system that is robust enough to absorb this error. Additionally, the measuring device in the development lab may be different from or of better resolution than the one on the production floor, at which point repeatability becomes a concern.
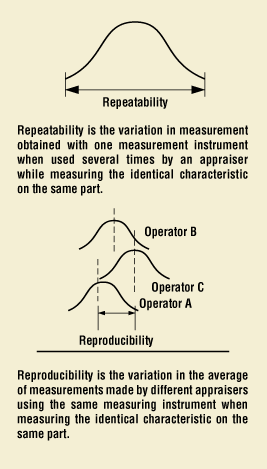 Figure 4. The concepts of repeatability and reproducibility.
The issue is quite obvious when viewed mathematically. Since variance is an additive function, the total observed variance can be expressed as the sum of the variances of the part and of the measurement system (or gauge) itself:

If the variability of the gauge is shown to account for a higher percentage of the total variability, then the measurement system is not sensitive enough for the process.
In the case of simple dimensional measurements, a gauge R&R study is a straightforward process of collecting data by having several operators (typically at least two) make repeat measurements (usually three) on at least five parts. The standard deviations or ranges and averages then serve as statistics to evaluate the R&R. For measurement systems that involve multiple steps, such as analytical methods, it may be necessary to utilize analysis of variance (ANOVA) to estimate the variance components and identify the variance contribution of the measurement system itself. In the case of destructive measurements, Ingram and Taylor have suggested a method that incorporates analysis of means (ANOM) and SPC.3
The importance of establishing the capability of a gauge becomes even more significant as the capability of the process improves. Figure 5 demonstrates what happens when a process is improved without paying attention to its measuring system. In Figure 5(b), the variation due to the measurement error is greater than 50% of the total variation. Refer to Figure 6 for an example of an off-the-shelf software package that includes the functionality for conducting a gauge R&R study.
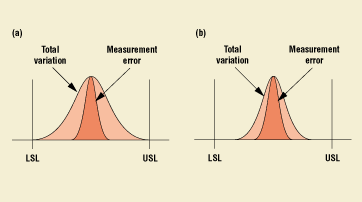
Figure 5(a). Depiction of a normal curve that is typical of the variation of a majority of processes. The dark area under this curve, also following a normal distribution, represents the error due to variation. Figure 5(b). As the process variation is improved, the variability due to the measurement system becomes a more significant contributor to overall variation.
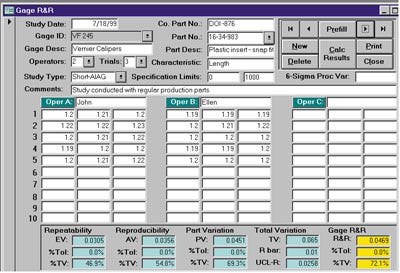
Figure 6. An example of a completed data sheet for a gauge R&R study.
IDENTIFYING RELATIONSHIPS
The next stage is to identify the relationships among the various parameters (inputs or factors) and characteristics (outputs or responses). Traditionally, this has been done by using either tacit process knowledge or one-factor-at-a-time (OFAT) experimentation. While these remain viable methods for simple processes, a more complex unit operation will usually require a well-designed experiment to identify the relationships between factors and responses and the presence of interactions among factors. Design of experiments (DOE) is typically a two-stage process. The first stage consists of a set of screening experiments to determine which factors or parameters are the main contributors to the outputs.4 The second stage builds on the first by employing response surface methodologies (RSM) and contour plots to refine the findings and optimize the parameters.
The essential value of DOE is that it allows experimenters to express the manufacturing process or unit operation as a mathematical equation, which—upon verification of observed data—can then be used to predict the output (within the range of values experimented) with sufficient confidence. The scientist or engineer can then use the equation to identify optimal targets and establish operating windows.2 An important point to note here is that experimentation is effective only when experiments are well designed, controlled, and thoroughly analyzed.5 For further information on the theory, practice, and success of DOE, refer to articles referenced at the end of this article.6,7,8
Another method that enables development teams to establish relationships between parameters and characteristics is the use of process quality function deployment (QFD)—a structured analysis method, based on teamwork, in which customer requirements are translated into appropriate technical requirements. The basic QFD chart—which is a combination of matrices and the interrelationships between the matrices—is often referred to as a house of quality (Figure 7). A process QFD is different from a product QFD in that the "what room," or voice of the customer, consists of the lists of characteristics, and the "how room," or voice of the designer, is populated with the parameters (Figure 8). Most practitioners of QFD are familiar with how a product QFD can actually serve as a starting block for more detailed analysis (Figure 9). In process development, it is possible—once the characteristics and parameters have been identified—to proceed directly to the process QFD and establish the interrelationships via analytical means (Figure 10).
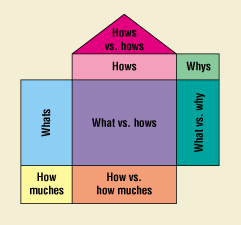 Figure 7. House of quality.
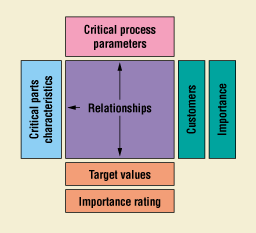 Figure 8. Basic process QFD chart showing "room" interrelationships.
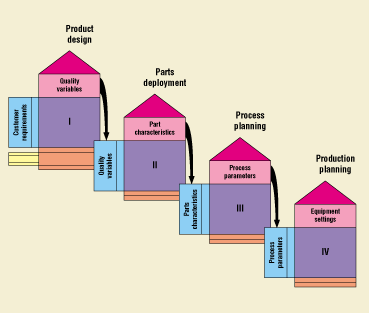
Figure 9. QFD evolution. Phase I: Product—used as a design tool to emphasize market-driven requirements as opposed to engineering-driven requirements. Translates customer requirements into product design requirements. Phase II: Parts—takes the design requirements from Phase I and translates them into specific design components. Phase III: Process—takes the design components from Phase II and translates them into key process operations. Phase IV: Production—takes the key process operations from Phase III and translates them into production requirements.
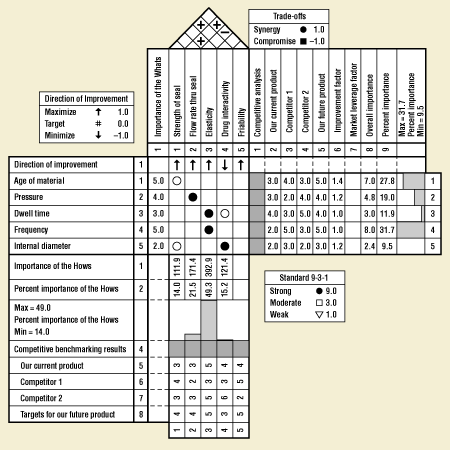
Figure 10. Example of a process QFD for sonic welding.
Completing a relationship analysis, such as the one described here, provides the engineer or scientist with a profound knowledge of the unit operation and the process as a whole. The developer has a model of the operation that describes optimum set points and how to compensate for variation. Further, a well-selected experimental space will identify what the probabilities of failure are and how closely the process is operating to those probabilities.
RISK ANALYSIS
As with good product design, process design should incorporate the systematic analysis of the potential failure modes, determination of the potential causes and consequences, and analysis of the associated risks.2 Failure mode and effects analysis (FMEA) and fault-tree analysis (FTA) are among the common approaches to achieving this goal. The primary difference between these two approaches is that FMEA is a top-down methodology whereas FTA is a bottom-up approach.
The key to integrating FMEA with the other methods and tools mentioned in this article is to assign each potential cause of failure to at least one of the identified parameters (inputs). If none of the parameters in the existing list can be associated with this potential cause of failure, a new variable may have to be identified. A risk priority number (RPN) can then be computed for each parameter, indicating the level of risk associated with the specific parameter. The RPN is calculated based on the severity (S) of the failure mode, the frequency of occurrence (O) of a cause, and the ease of detection (D) associated with a cause such that
RPN = S X O X D.
When the RPN is computed for each input, it will be possible to isolate the inputs that pose the greatest risk. Some of the additional benefits of a well-planned and well-executed FMEA are:
Saving development costs and time (avoiding the "find-and-fix" syndrome).
Establishing a guide to more efficient test planning.
Assisting in the development of preventive maintenance systems.
Providing quick reference for problem solving.
Reducing engineering changes.
IDENTIFYING THE VITAL FEW ELEMENTS
After identifying the elements, determining their relationships, and establishing which of them are high-risk, it is possible to pare the list of parameters and characteristics. In a structured process development activity, the tacit goal is to release a robust process to manufacturing that requires the minimum number of process controls. The logic behind this is that a well-characterized, well-designed process is viable within the established operating window. Although attempting to monitor all possible parameters and characteristics is likely to be futile, there will always be a number of critical elements that require continued study and control.
One must obtain a good understanding of the process to separate the vital few from the trivial many. Standard Pareto analysis is the most direct way to achieve this goal. By integrating the results of designed experiments, QFD, and risk analysis (FMEA), it is possible to rank these inputs (parameters) and outputs (characteristics) and separate out the 20–25% that are the most significant.
PROCESS CAPABILITY
Capability refers to the ability of a process to operate within the specification limits. Until a parameter or a characteristic in a process is behaving in a capable manner, it will impede any attempts to place the process under control. The most common measures of capability are the Cp and Cpk indices. The Cp index measures the spread of the data relative to the spread of the specification limits, and the Cpk index measures how well the process is operating relative to its target (Figure 11).
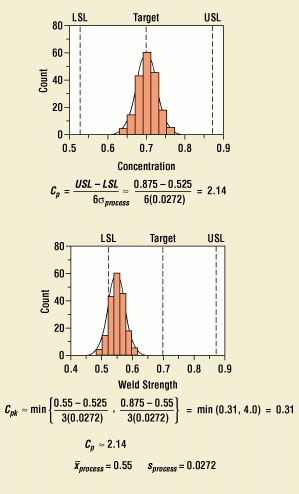 Figure 11. Process capability measures.
There are various industry standards and rules of thumb concerning what the minimum value of Cp and Cpk should be, but this value is best determined based on one's experience in the industry and with the process. For example, the famous rule of six sigma may apply to the manufacture of consumer electronics but may be economically impractical for other types of processes. Six sigma is a way to measure the chance that a unit of product can be manufactured with virtually zero defects.
For variables data, six sigma is Cp > 2 and Cpk > 1.5; for attributes data, six sigma is no more than 3.4 defects per million. The basic six sigma premise is that:
All processes have variability.
All variability has causes.
Typically, only a few causes are significant.
To the degree that those causes can be understood, they can be controlled.
Designs must be robust to the effects of the remaining process variation.
The above assumptions are true for products, processes, information transfer, and everything else.
STATISTICAL PROCESS CONTROL
Once a process is deemed capable, it is possible to proceed to SPC. What is different in a planned approach to process development and technology transfer is that the developers share the responsibility of developing the control limits and the corrective actions for possible out-of-control situations. It is up to the process experts to build a knowledge database of what corrective actions to take. It is worth noting that SPC charts do not have an infinite life span, and the need for specific charts should be periodically revisited. If the particular variable being measured has displayed very stable and capable behavior over an extended period, it may be time to retire the chart.
ITERATION
The process described in the previous section is not a straight-through, one-pass system. It may be necessary to go through several iterations before a process or unit operation is characterized and sufficiently optimized to be turned over to manufacturing. For example, there may be a need to perform several screening experiments and possibly identify or include new variables that have not been thought of before. Similarly, if a process does not meet capability expectations, it may be necessary to go back to an earlier step to adjust parameter set points.
TYING IT ALL TOGETHER
The formal methodology described here not only applies to individual unit operations but also to an entire process. Once the various unit operations are fully defined and characterized, it is possible to treat the set of unit operations as a group or master operation and optimize at that level (Figure 12). This is important because some suboptimization at the unit level is usually required to achieve overall process optimization.
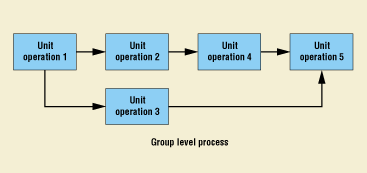
Figure 12. Combining unit operations into a higher-level grouping.
None of the concepts presented here are new or newly interpreted. What is new, however, is the use of a structured manner for utilizing and integrating these powerful statistical and analytical methods. For example, when using a structured method, the inputs and outputs defined in step 2 (Defining Inputs and Outputs of Each Unit Operation) become the starting point for step 4 (Identifying Relationships), and the results are measured with confidence in the measuring system because of the work performed in step 3 (Measurement Capability Analysis). In step 5 (Risk Analysis), the risk of process failure is evaluated by tying causes of failures to the inputs indentified in step 2. The ability to focus on the most critical elements in step 6 (Identifying the Vital Few Elements) builds upon the RPN from step 5 and the influences between inputs and outputs identified in step 4. Process capability is measured based on process descriptions identified in step 2, and it is only with an acceptable capability measure that one should move to the next step of implementing SPC.
Most organizations employ either some or all of the methodologies mentioned in this article; however, these methodologies operate in pockets of excellence. Just as ordinary pockets are sewn up to prevent the contents from going anywhere, pockets of excellence are sealed away in organizations, limiting an organization's ability to leverage process development and improvement activities.
Furthermore, by consistently employing a step-by-step scientific approach to process development within a company, the next steps—process validation and technology transfer—are significantly simplified. A substantial portion of the requirements for process validation is actually achieved by this structured approach.2
CONCLUSION
It is clear that improvements in the design and development process are essential if one is to realize process optimization gains.9 The excuse that economics or time pressures make a structured approach infeasible is common but misplaced. The need to define, characterize, optimize, validate, and control a process is irrefutable. By using the structured approach recommended here, scientists and engineers can focus their skills on developing and improving processes and thus make the best use of their valuable time and talents. Organizations that claim to have successfully transferred a process to manufacturing but that continue to deploy R&D resources to support and fix the process are simply playing with semantics. If the R&D resources are being used in manufacturing to get a process that is not fully characterized to work, this is still a development activity, and the process has not been transferred successfully. By adhering to the road map described here, process development teams will be able to focus their energy and efforts on doing it right the first time, thereby delivering fully developed and optimized processes more quickly.
REFERENCES
1. JS Kim and M Larsen, "Improving Quality with Integrated Statistical Tools," Medical Device & Diagnostic Industry 18, no. 10 (1996): 78–83.
2. Draft Global Harmonization Task Force Study Group 3, Process Validation Guidance (1998).
3. David J Ingram and Wayne A Taylor, "Measurement System Analysis," ASQ's 52nd Annual Quality Congress Proceedings (Philadelphia: ASQ, 1998).
4. M Anderson and P Whitcomb, "Design of Experimental Strategies," Chemical Processing Annual (Itasca, IL: Putman,1998).
5. A Khurana, "Managing Complex Production Processes," Sloan Management Review 40, no. 2 (1999): 85–97.
6. Mark J Anderson and Paul J Anderson, "Design of Experiments for Process Validation," Medical Device & Diagnostic Industry 21, no. 1 (1999): 193–199.
7. JS Kim and James Kalb, "Design of Experiments: An Overview and Application Example," Medical Device & Diagnostic Industry 18, no. 3 (1996): 78–88.
8. John A Wass, "Formal Experimental Design and Analysis for Immunochemical Product Development," IVD Technology 3, no. 5 (1997), 28–32.
9. DP Oliver, "Engineering Process Improvement through Error Analysis," Medical Device & Diagnostic Industry 21, no. 3 (1999): 130–149.
BIBLIOGRAPHY
Box, George E P, William G Hunter, and J Stuart Hunter. Statistics for Experimenters: An Introduction to Design, Data Analysis, and Model Building. New York: Wiley, June 1978.
Clements, Richard B. Handbook of Statistical Methods in Manufacturing. Saddle River, NJ: Prentice-Hall, March 1991.
Cohen, Lou. How to Make QFD Work for You. Reading, MA: Addison-Wesley, July 1995.
Juran, J, ed. Quality Control Handbook. New York: McGraw-Hill, March 1999.
King, Bob. Better Designs in Half the Time. Salem, NH: GOAL/QPC, December 1989.
Trautman, Kimberly A. The FDA and Worldwide Quality System Requirements: Guidebook for
Medical Devices. Milwaukee: ASQC Quality Press, October 1996.
Raymond Augustin is project manager for the Starfire groupware system for Brooks Automation Inc. (Chelmsford, MA). He holds masters degrees in industrial engineering and business administration, and is an ASQ-certified quality engineer and software quality engineer.
Return to the MDDI January table of contents | Return to the MDDI home page
Copyright ©2000 Medical Device & Diagnostic Industry
You May Also Like
