
Sign up for the QMED & MD+DI Daily newsletter.
PACKAGING
+1
11 Min Read
.svg?width=850&auto=webp&quality=95&format=jpg&disable=upscale "Using Hypothesis Testing in Medical Packaging Validation")
|
Figure 1. (click to enlarge) Effect of temperature on seal strength. The green bars represent samples created using low temperature. The orange indicates packages created using the high-temperature setting. |
Medical device manufacturers must ensure that their products reach end-users in a safe and functional condition. They are also required to employ validation protocols that will provide evidence that their processes, including package creation, will consistently produce the specified outcomes. Sometimes considered an elusive concept by nonstatisticians, statistical power has the ability to make experimental protocols valuable for solving problems, worthless for solving problems, or both worthless and potentially harmful.
For medical packaging engineers, the critical question is whether there is enough information available from sample testing to draw appropriate conclusions about the packaging line. Are the sampling data misleading or do they support the decision to validate the production process? This article explores the concept of statistical sampling.
Hypothesis Testing
During validation, as well as during ongoing production testing, samples are used to make inferences and, ultimately, decisions about a larger population. The first step in such an approach is the formation of a hypothesis, i.e., a factual statement, that will then be accepted or rejected based on the results of the samples tested.
In some applications, hypothesis testing is used to determine whether two groups are different from each other. In such exercises, there are always only two possible conclusions: one is called the null hypothesis (H0) and the other is the alternative hypothesis (HA). For example, packaging sealed at two different temperature settings could be tested to determine whether temperature has a significant effect on seal strength. In this example, H0 would indicate that the two groups are equal—i.e., temperature has no effect on seal strength, while HA would indicate that the two groups were different—i.e., sealing temperature has a significant effect on seal strength (see Figure 1).
A special case of hypothesis testing involves evaluating a group of samples to determine whether a particular standard or other requirement is being met. Again, there are two possible conclusions, HA and H0, which correspond, respectively, to whether the requirement is being met or not. It is this form of hypothesis testing that is used for validation studies.
|
Being forced to make a possibly critical decision based on test results that can yield only two possible outcomes may present difficulties. What if one is not sure which outcome is true? In such cases, the null hypothesis (H0) is considered the favored hypothesis. This situation is similar to a jury trial, for which jurors must decide guilty or not guilty. The judge's instruction to the jurors is that they must return a verdict of not guilty unless they are certain of guilt beyond a reasonable doubt. Not guilty is the favored hypothesis (H0). Interpretation of the two outcomes is also affected. A not guilty decision does not mean the person on trial is innocent. It only means that there was insufficient evidence to prove guilt. A guilty verdict, on the other hand, carries the implication that the defendant has been proven guilty beyond a reasonable doubt.
For validation studies, a failure to reject H0 indicates that the requirement is not met, while rejecting H0 (thereby accepting HA) implies that the sample population meets the standard. Consider, for example, a test situation involving packaging defect rates. Assuming that the defect rate specification is below 1%, H0 would mean that the defect rate is 1% or above and accepting HA would indicate there was a defect rate below 1% (HA is the desired outcome of the validation). In other words, rejecting H0 in favor of HA means the validation study was successful.
In addition to its applicability in validation studies, hypothesis testing can also be used in production line acceptance sampling. Acceptance sampling involves a choice between two outcomes: pass/fail or accept/reject. A test result of pass or accept means that the product lot can be released, and fail or reject means the lot must be destroyed or placed on hold.
|
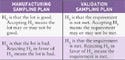
Table I. (click to enlarge) Comparative assumptions of manufacturing and validation sampling plans. |
The fundamental difference between validation sampling plans and manufacturing sampling plans is that the burden of proof shifts, as shown in Table I. Hypotheses H0 and HA are aligned to the accept or reject decisions differently. In manufacturing, a lot is assumed good until proven bad. In validation, it is assumed that the requirement has not been met unless testing demonstrates it is so. The two situations have opposite burdens of proof. As a result, it is not appropriate to use a sampling plan developed for use in manufacturing line applications for the purpose of validation.
Statistical Power
Statistical power has been defined as the probability of rejecting the null hypothesis when it is false and some specified alternative is true.1 In the defect rate example, discussed above, this power corresponds to the ability to reject H0—the defect rate is 1% or above—when HA is true, the defect rate is below 1%. How much below 1% the defect rate actually is would be the “some specified alternative” cited in the definition. The probability of rejecting H0 differs depending on the true defect rate.
To fully appreciate the concept of statistical power, it is important to first understand the two types of errors that can be experienced when running an experiment. Consider, for example, a simple situation involving a bucket of marbles, 97 of them blue and 3 of them red. An initial sample of 20 marbles might yield 2 red marbles and 18 blue marbles, indicating that the defect rate is 10%. However, after all of those marbles are put back, a second sample of 20 marbles may result in all blue ones, for a 0% defect rate. The results of the first sample, which indicated a higher defect level than was actually present in the batch, represent one type of error. However, the second sample is also a type of error.
Statisticians call these type I (alpha) and type II (beta) errors. Type I (alpha) is associated with the producer's risk, because the manufacturer is taking a risk of rejecting a good batch of product. Type II (beta) errors are considered consumers' risk, because the consumer is risking the use of a defective product. It is more critical to avoid type II errors when performing medical packaging validation, to protect the consumer. Proclaiming a packaging system sufficiently validated when in fact it is providing nonsterile units to the field can put people exposed to those units at risk.
In general terms, a type II error affects the probability of accepting HA (that the requirement is met) when, in actuality, H0 (that the requirement is not met) is true and some product is bad. Suppose the type II error is 5%, then the probability of rejecting HA when H0 is true is 100% �– 5%, or 95%. This percentage represents the confidence level, i.e., accepting HA allows one to state with 95% confidence that HA is true. Conversely, type I error affects the probability of rejecting good product, that is, by accepting H0 when HA is true. Again, suppose the type I error is 5%, then the probability of rejecting H0 when HA is true, is also 95%. However, in this case, 95% represents the statistical power.
Using Software to Determine Sample Size for Validation
|
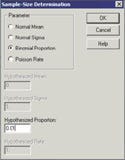
Figure 2. (click to enlarge) Example of a sample-size determination screen. |
In the past, choosing the optimal sample size for a package validation protocol could be challenging and many manufacturers opted for familiar, but inappropriate, techniques.2 Many statistical software packages have features for calculating the appropriate sample size for hypothesis testing. One such package, Statgraphics (version 5.0), is used in the discussion below to illustrate the applicability of software for a validation study demonstrating that a packaging process has a defect rate of below 1%. In this example, H0 is that the defect rate is 1% or above and HA is that the defect rate is below 1%. Other study parameters include a specified alternative between 0.1% and 0.01%, a confidence level of 95% (type II error = 0.05), and a statistical power of 95% (type I error = 0.05).
|
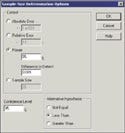
Figure 3. (click to enlarge) Comparative assumptions of manufacturing and validation sampling plans. |
The first step in using software to calculate sample size is to select the Sample-Size Determination menu item, which yields a dialog box as shown in Figure 2.
On the screen in Figure 2, select the parameter Binomial Proportion and enter 0.01 in the box labeled Hypothesized Proportion. This proportion corresponds to the null hypothesis that the defect rate is 1% or above. When this has been accomplished, click the OK button and a dialog box appears (see Figure 3).
|
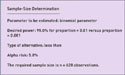
Figure 4. (click to enlarge) Example of a sample-size results screen. |
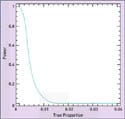
There are four options to be selected on this screen. Enter 0.009 in the Difference to Detect box, representing the specified alternative range of 0.01–0.001. Also enter the power as 95%, corresponding to the 5% chance of making a type I error, and also enter 95% for the desired confidence level, which corresponds to a 5% chance of making a type II error. Finally, select Less Than as the Alternative Hypothesis and the results (as shown in Figure 4) will be displayed. In this summary, Alpha is the type II error rate corresponding to the specified 95% confidence level. The sample size result is 628, meaning that 628 samples are required to distinguish between defect rates of 1 and 0.1%. The resulting power curve shown in Figure 5 indicates the corresponding probabilities of the validation being successful. At 0.001 proportion defective, with an actual defect rate of 0.1%, the chance of passing the validation rate is 0.95 or 95%. At 0.01 proportion defective, with a defect rate of 1%, the chance of a successful validation is 0.05 or 5%. If 628 samples are tested and H0 is rejected in favor of HA, one can state with 95% confidence that the defect rate is less than 1%. If the defect rate is less than 0.1%, there is a 95% chance of a successful validation.
|
Figure 5. (click to enlarge) Power curve for a sampling experiment for which Alpha = 0.05 and n = 628. |
Conclusion
Medical packaging engineers can use hypothesis testing in a variety of ways. It can be used to validate packaging processes, as well as to monitor them on a daily basis. However, it should be remembered that the burden of proof differs in these respective applications. When hypothesis testing is performed during packaging validation, software can be used to specify the acceptable defect level, the detectable difference, and the corresponding probability of the validation being successful. From these data, software can calculate the sample size needed to mini-
mize the two types of errors associated with running an experiment.
Acknowledgment
The substance, recommendations, and views set forth in this article are not intended as specific advice or direction to medical device manufacturers and packagers, but rather are for discussion purposes only. Medical device manufacturers and packagers should address any questions to their own packaging experts. Manufacturers have an independent obligation to ascertain and ensure their own compliance with all applicable laws, regulations, industry standards, and requirements as well as their own internal requirements.
Nick Fotis is the director of the Packaging Technology Center at Cardinal Health's (McGaw, IL) clinical and medical products segment. He can be reached at [email protected]. Wayne Taylor, PhD, is the founder and chairman of Taylor Enterprises Inc. (Libertyville, IL). Contact him at [email protected]. Laura Bix, PhD, is an assistant professor for Michigan State University's School of Packaging. Bix can be e-mailed at [email protected].
References
1. W Mendenhall, R Beaver, and B Beaver, “Chapter 15: Nonparametric Statistics,” in Introduction to Probability and Statistics (Florence, KY: Duxbury Press, 1994), 664.
2. N Fotis and L Bix, “Sample Size Selection Using a Margin of Error Approach,” MD&DI 28, no. 10 (2006): 80–89.
Copyright ©2008 Medical Device & Diagnostic Industry
About the Author(s)
You May Also Like