Sign up for the QMED & MD+DI Daily newsletter.
Medical Device & Diagnostic Industry MagazineMDDI Article IndexOriginally Published August 2000
August 1, 2000
19 Min Read
.svg?width=850&auto=webp&quality=95&format=jpg&disable=upscale "How Small Is Small? The Effects of Pinholes on Medical Packaging")
Learn More! The authors of this article will be presenting their data at Medtec, Oct. 11-13, 2000. |
Earl T. Hackett, Michael H. Scholla, Stasys Rudys, and John Bletsos
 Within the medical device community, package defects are considered a serious threat to the long-term sterility of terminally sterilized products. In one series of tests performed on approximately 9000 commercially packaged medical devices, approximately 0.2% of the packages examined had holes in either the packaging materials or the seal. Both destructive and nondestructive tests have been developed to detect the presence of package defects. In cases where the sensitivity of the test has been determined, the smallest defect that can be detected is in the 25–50-mm range1 This raises the question, "Do pinholes that are smaller than the detectable size pose a significant threat to the sterility of the packaged device?"
There are two mechanisms by which an airborne particle can penetrate a hole in a package: the particle can be carried via an air current or, in the case of a large particle that has a significant settling rate, it can simply fall through the hole due to gravity. This article recounts an experiment set up to address the first contamination mechanism, and describes how porous packaging can be designed such that the sterility of a product is not threatened by airborne microbes moving through holes in the undetectable size range.
CONCEPTUAL APPROACH TO THE PROBLEM
Limitations in the capabilities of particle-counting instruments make it impossible to directly measure the number of particles flowing through a hole in an otherwise impermeable membrane. Therefore, the basic concept utilized in this study was to consider the barrier properties of the total structure both with and without a hole. If there is no significant difference in the percentage of particles penetrating the two samples, the barrier characteristics are considered unchanged by the presence of a hole. It could also be argued that the increased probability of contamination of a packaged device is proportional to the relative increase of particle penetration when a hole is present.
The intent of the study reported here is not to establish the foundation for a rigorous quantitative analysis. This may be possible in the future, but there are many critical variables that were not addressed in the study. Rather, the objective is to determine if the sensitivity of current defect-detection tests is adequate for identifying significant defects. Since flow through a long channel is less than flow through an orifice of the same diameter, an orifice test was selected for the study.
BASIC FILTRATION THEORY
Porous barrier materials for medical packaging function as depth filters and follow the physical laws associated with filtration theory.2 Although particulate-barrier or filtration materials reduce the number of suspended particles passing through them, some particles avoid capture. The difference between the particulate concentration before and after passing through the filter medium is known as filtration efficiency. The measured filtration efficiency for any given material will vary over a wide range as a function of aerodynamic particle size and air velocity.
The mechanism for removal of large particles at high velocity (typical of heating, ventilating, and air-conditioning (HVAC) systems) is through interception by or inertial impaction on the fibers of the filtration media. Large particles—because of their high inertia and inability to follow the air current around the fibers—are removed more effectively in this environment than are small particles. In sterile packaging, one is more concerned with small particles moving at very low velocities—specifically, airborne microbial spores driven by low pressure differentials created by package handling or air and ground transport. In this environment, diffusion caused by random particle movement is the primary filtration mechanism. These effects are only seen at very low flow rates, and, therefore, cannot be investigated with common filtration test equipment intended for the HVAC industry.
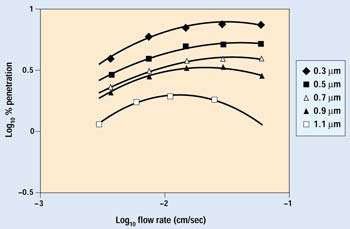
Figure 1. Percent penetration as a function of flow rate and particle size.
Figure 1 shows the filtration efficiency curves of a test paper for various flow rates and particle sizes. The flow rate—sometimes referred to as face velocity—is the velocity of a column of air with the same cross-sectional area as the sample. The transition of the governing mechanism from inertial impaction to diffusion with face velocity is most clearly seen in the 1.1-mm particle curve. The point at which the dominance of these mechanisms reverses is the most penetrating velocity for that particle size. At velocities lower than the point of maximum efficiency, particle removal is dominated by diffusion, by random Brownian motion, and, in the case of Tyvek protective material (DuPont, Wilmington, DE), by electrostatic charge. These mechanisms require time to permit particles to move across the airstream and contact a fiber. As face velocity lessens, the percent of particle penetration decreases. As flow approaches zero, residence time in the media becomes indefinitely long, and the suspended particle concentration nears zero. A linear extrapolation of the data to lower flow rates can thus be made. On the other hand, as the face velocity increases beyond the point of maximum penetration, particle removal becomes dominated by inertial impaction. The point at which this changeover occurs depends on the particle size and the fibrous structure of the filtration material.3
Most of the data in this experiment were generated at very low flow rates. Examination of a typical data curve shows that as flow and pressure differential increase, the particle penetration also increases because there is less time for Brownian motion and electrostatic forces to direct a particle to the fiber surface. The level of particle penetration will continue to rise with increasing flow rate until the most penetrating velocity is reached. From that point on, particle penetration will decrease, as particle removal by impaction becomes the dominant factor. The ASTM 1608 Standard Test Method for Microbial Ranking of Porous Packaging Materials (Exposure Chamber Method) uses face velocities far above the most penetrating velocity and thus provides only impact filtration data. It provides no information on a material's filtration efficiency at the very low velocities typical of normal package handling.
GAS TRANSMISSION THROUGH POROUS PACKAGING
In the case of medical packaging, events that would cause air to flow in or out of a package include:
Ascent or descent during air shipment.
Heavy vibration or shock during truck transport.
Handling.
Opening and closing storage-room doors.
Changes in barometric pressure.
The volume of air passing through the porous structure is directly proportional to the product of the pressure change and the package volume. The rate at which the volume of air flows through the porous package surface is inversely proportional to the surface area of the porous material and the length of time over which the event takes place.
For example, during a typical aircraft landing, recording barometers have shown that the pressure in the cargo hold will increase from 25 to 30 in. Hg in approximately 30 minutes. Consider a rigid tray that measures 10 x 20 x 10 cm with a lid covering a 10 x 20-cm open area. A first-order approximation of the flow rate through the sample would be (2000 cm3)([30 – 25 in.Hg]/30 in.Hg)/(30 min) or 10 cm3/min. The face velocity for this example would be approximately 10 cm3/min/(10 x7nbsp;20 cm), which equals 0.05 cm/min. Pressure differentials at this flow rate are approximately 3 cm water column (WC) for coated systems and 0.8 cm WC for uncoated systems.
PARTICLE TRANSMISSION
As mentioned previously, at very low pressure differentials a particle can pass through a hole either by being carried on an air current or simply by settling due to gravity. For slow settling speeds, the terminal settling velocity (vs) of a particle relative to the carrier gas is governed by the equation
where a is the aerodynamic radius of the particle, r is the gas density, p is the gas pressure, C is the Stokes-Cunningham slip correction factor, g is acceleration due to gravity, and m is the gas viscosity.4,5 A particle diameter of 0.5 mm was selected for testing because its settling velocity of 0.01 cm/sec under normal atmospheric conditions is very small compared with the flow rates used in this experiment. By comparison, a 2-mm-diam particle would have a settling rate of 0.15 cm/sec.
In engineering theory, airflow between two chambers is viewed as flow through a pipe or an orifice. The two cases are distinguished by the factors that govern or limit flow. Flow through an orifice is restricted primarily by the rate at which the pressure differential can accelerate the gas into the aperture,
where R is the molar gas constant, T is absolute temperature, M is the gas molecular weight, A is the area of the aperture, and DP is the pressure differential. This equation applies not only to circular apertures but to those of other shapes as well.
For a tube, the governing equation is
where d and l are the diameter and length of the tube, respectively.6 This equation holds true only for tubes with circular cross sections; for any other cross-sectional shape of the same area, the flow will be significantly lower.
While it is tempting to use these equations in a quantitative study of a pinhole leak, several items must be resolved before the equations can be employed. First, they have been shown to be valid down to pressure differentials of about 1 psi. This is several orders of magnitude higher than the pressures of interest in medical packaging. Second, the equations for flow through an orifice and a tube are substantially different. For example, a small channel in a seal meets the criteria for a tube. However, a pinhole in a film might have an aspect ratio of 10:1, which may not meet the definition of flow through either an orifice or a tube. Some combination of the two equations may be required to obtain a reasonable model for this situation. Finally, molecular weight prominently figures in these equations. The test gas has a high concentration of aerosol particles whose total weight is minute compared with the weight of the air. At high pressure differentials, the aerosol particles should have no effect on airflow, but it is unknown whether this will be the case at the very low pressures used in this investigation.
SAMPLE PREPARATION
For this test series, samples of coated and uncoated Tyvek 1073B measuring 10 cm in diameter were used as the barrier material. A small hole measuring approximately 5 mm in diameter was cut in the center of each sample. A hole of the desired diameter (25-, 50-, or 125-mm) was drilled in the center of 2.5-cm-diam pieces of 75-mm-thick stainless-steel shim stock. Tyvek samples were then sealed to the shim stock pieces using a room-temperature-vulcanized (RTV) silicone adhesive so that the hole in the shim stock centered on the hole in the Tyvek. This created a series of samples with repeatable, well-defined "defects." The available surface area of the Tyvek was about 73 cm2. The face velocity would be the flow rate in cubic centimeters per minute divided by 73 cm2. In this test, face velocities from approximately 13 to 0.015 cm/min were examined.
TEST METHODOLOGY
Tests were performed using an oil aerosol in a custom designed, barrier test chamber. A polydisperse aerosol was generated using a condensation aerosol generator under conditions that produced a very high concentration of particles around the target size of 0.5 mm. This target size was chosen because it is large enough to be removed primarily by impaction, yet still small enough to avoid significant blockage of a 25-mm hole or blinding of the barrier material over the course of the test. It is also indicative of a bacterium, which can range in size from 0.22 mm to larger than 2 mm. The 0.5-mm particles were extracted from the aerosol using an electrostatic classifier and supplied to the sample holder at concentrations in the range of 20,000 to 40,000 per cubic centimeter.
Samples were mounted in the holder and the challenge aerosol was drawn through the material at various flow rates. The highest pressure differentials were generated at a calibrated flow rate of 1000 cm3/min. At lower pressures, a sweep of HEPA-filtered air was used to collect the particles and deliver them to the particle counter. In the calculations, a correction for the dilution of the particle concentration by this filtered airstream was made.
At the velocities used in these tests, the pressure differential is a linear function of the flow rate. Each series of test conditions started with the 1000 cm3/min calibrated flow rate and progressed through lower flow rates until the limit of the available flow-control apparatus was reached. After completing the low-flow-rate tests, a final test at the calibrated 1000 cm3/min rate was run to check for any drift in the sample that might have been caused by the collected aerosol particles. After this test series, the hole was plugged with an RTV sealant and a second test series that closely followed the first was performed on the same sample.
DATA COLLECTION
Concentration of the challenge aerosol was continuously monitored with a condensation particle counter. Any particles penetrating the barrier material were collected and continuously recorded using a second condensation particle counter. The primary variable was the pressure differential across the barrier material, which was set and held constant. Although the system is capable of completing a test series in a fully automatic mode, it was operated manually for this series of tests. Each reported value is the average of 30 to 40 independent measurements of challenge and filtered aerosols at the particular pressure differential.
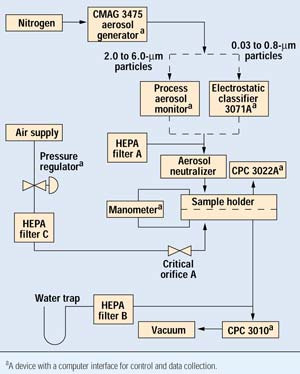 Figure 2. Schematic representation of test equipment.
A schematic representation of the equipment used in this experiment is presented in Figure 2. In operation, the aerosol generator was set to generate an aerosol consisting of a range of small particles. The aerosol was then delivered to the electrostatic classifier where particles of the desired size were extracted and passed on to the aerosol neutralizer. The test specimen divides the sample holder into top and bottom sides. The manometer continuously monitors the pressure across the specimen. Above the sample, the input condensation particle counter (CPC) continuously monitors a small sample of the challenge aerosol to determine the particle concentration. Below the sample, the output CPC draws a constant 1.00 L/min sample and monitors particle concentration.
To vary flow through the sample, a precision pressure regulator is adjusted to deliver air through HEPA filter C to a small orifice. This can be adjusted to make up 100% of the output CPC demand, at which point flow across the sample ceases.
DATA ANALYSIS
Table I shows a typical set of data, with the resultant plot shown in Figure 3. Bold text indicates data taken directly from an instrument. The other values are the result of calculations to correct for the dilution of the aerosol coming through the test material as a result of the HEPA-filtered air entering from the downstream side of the sample holder. The first pressure drop is generated by the constant demand of the output CPC for a flow rate of 1 L/min with no HEPA air dilution. At the pressures in these experiments, flow rate is directly proportional to pressure drop, which allows for easy calculation of the actual flow through the sample. Face velocity is calculated based on the 10-cm-diam sample. The flow through the sample plus the makeup from the HEPA air supply must equal the 1000 cm3/min demand of the particle counter. This allows for the calculation of the particle concentration in the air that is exiting the filter material—which is used to calculate the percent penetration.
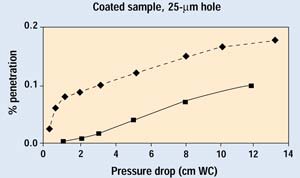 Figure 3. Plot of typical test data set. The solid line is a repeat test on the same sample with the hole plugged.
An initial set of tests was performed on coated and uncoated samples with 25-, 50-, and 125-mm holes. The pressure differential in this series of tests was allowed to range as high as several centimeters WC pressure. This pressure differential is far higher than would be encountered in normal transportation of packaging devices, but the higher flows were necessary to get a sufficient number of particles through the coated samples.
After data were analyzed, it became obvious that the penetration curves showed a change in slope as pressure differential rose beyond 2 cm WC. At this pressure differential, the flow pattern changed and large numbers of particles became lost due to an unknown mechanism. None of the classical filtration equations explained this observation. Reynolds numbers—associated with the flow experienced in this experiment—indicate that flow will be laminar under all conditions. The most reasonable explanation of this observation was due to toroidal flow at the exit of the hole, as shown in Figure 4. As flow rate through the hole increases, the aerosol stream exiting the hole initiates the toroidal flow, in which particles are repeatedly injected into the exiting stream. The resulting large number of particle collisions will decrease particle counts and invalidate data taken at higher pressures.
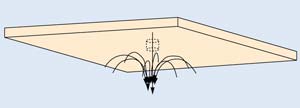 Figure 4. Illustration of toroidal flow around a pinhole.
Since a large portion of the data was at pressures above 2 cm WC, the experiment was repeated with the pressure differential limited to less than 1 cm WC.
DEFECTS IN POROUS STERILE PACKAGING SYSTEMS
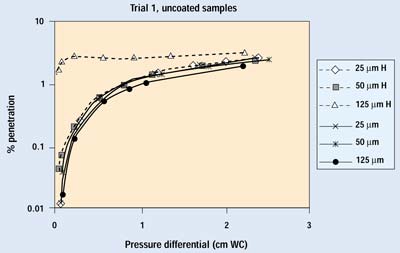
Figures 5 and 6 show the complete set of results from the first trial. The lowest pressure in these tests is approximately equivalent to the highest pressure a package would be expected to experience in transit—the repressurization of the cargo compartment of an aircraft during descent for landing. Diffusion is the primary removal mechanism in all of these tests. The exponential improvement in barrier performance as flow rate decreases is readily apparent.
Figure 5. Initial test results on uncoated samples. H indicates data with the hole open.
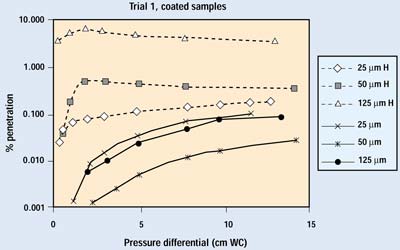
Figure 6. Initial test results on coated samples. H indicates data with the hole open.
Comparing the figures, an immediate conclusion is that the porosity of the packaging material has a major effect on the degree of particle penetration through any given defect. For a given package and volume of air exchange, a more permeable barrier material will allow more of the exchange air to move through the barrier material, rather than forcing it through the defect. In the test, samples of a highly permeable barrier material (uncoated Tyvek 1073B) with small defects (25–50 mm) showed little or no discernible difference in the amount of particle penetration when compared with the same material without a defect. Hence, a lower permeability or lower ratio of porous surface area to package volume will increase the amount of unfiltered air passing through the defect.
Figures 7 and 8 show the results from the second trial run of several samples with 25- and 50-mm holes. Sample numbers followed by H indicate an open hole. The samples with a 25-mm hole show no differences down to 0.1 cm WC. The samples with 50-mm holes begin to show some deviation from normal performance as pressure drops below 0.2 cm WC. Because the pressure differentials of greatest interest are below this point, one would have to conclude that a 50-mm defect in a package constructed with a more permeable, noncoated porous medium causes a small degradation in barrier performance.
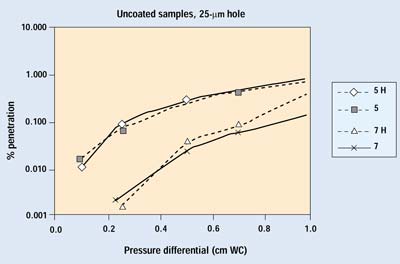
Figure 7. Results of the second trial for Samples 5 and 7 with a 25-µm hole. H indicates data with the hole open.
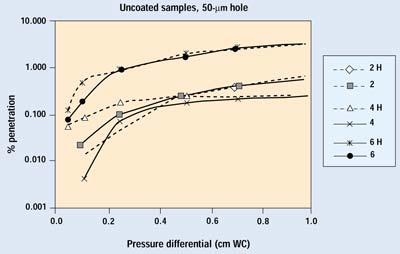
Figure 8. Results of the second trial for Samples 2, 4, and 6 with a 50-µm hole. H indicates data with the hole open.
Figures 9 and 10 show the results on coated barrier material from both trials. Data in the 0.001 to 0.0001% range are at the sensitivity limit of the current system, which is set by the number of particles penetrating the HEPA filter. Coated materials are much less permeable than their uncoated counterparts; therefore, a greater proportion of air will pass through a defect when a coated material is used. The lower permeability of a coated material also reduces the velocity of the aerosol within the filter media, resulting in much greater filtration efficiency. Although the difference in performance with the 25-mm hole is readily apparent, the overall filtration performance of the coated sample with the 25-mm hole is better than its undamaged, uncoated counterpart—which is widely recognized as an outstanding barrier material.
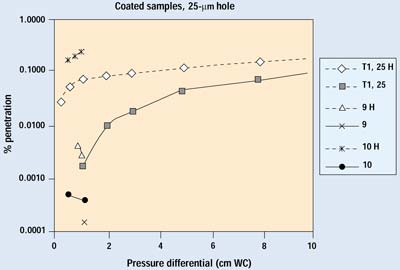
Figure 9. Results of Trials 1 and 2 for selected samples with a 25-µm hole. H indicates data with the hole open.
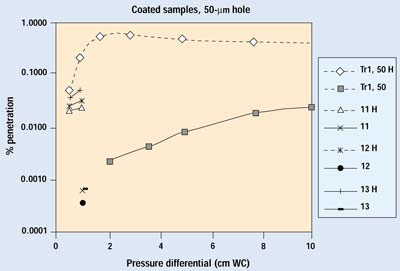
Figure 10. Results of Trials 1 and 2 for selected samples with a 50-µm hole. H indicates data with the hole open.
In the case of the 50-mm hole, 99% of the detected particles came through the hole—resulting in a more than 0.1% increase of overall penetration at higher pressure differentials. This is comparable to the performance of its uncoated counterpart. Therefore, a 50-mm hole can be considered the upper limit for nonthreatening defects.
CONCLUSION
For a given package, greater permeability in the barrier material imparts a greater tolerance of package defects. The data presented here indicate that using a material with high permeability in a well-designed package can provide an effective barrier system—even when a hole of 25 mm or smaller is present. Test methods shown to detect defects down to at least 50 mm in diameter—such as dye penetration and helium leak—are adequate for integrity testing of porous medical packaging.
The ability to understand and produce the effect of various types and sizes of defects on a particular package design is of great value to the medical packaging industry. Further work is planned to verify that the equations governing gas flow are valid for small defects at very low pressure differentials; to examine the effect of high aerosol concentrations on gas flow; and to examine the mechanism of settling, which becomes more significant as particle size increases and flow rate decreases.
ACKNOWLEDGMENTS
The authors wish to thank Marcus Weber of Clemson University for his consultation concerning particle loss at higher pressure differentials.
Additional thanks are extended to Alan Tallentire and Colin Sinclair at Air Dispersions Ltd. (Manchester, UK) for their assistance and use of their laboratory facilities for performing the experiments.
REFERENCES
1. ET Hackett, "Dye Penetration Effective for Detecting Package Seal Defects," Packaging Technology and Engineering, August 1996.
2. MH Scholla, "The Effects of Radiation Sterilization on the Microbial Barrier Properties of Tyvek," Medical Device & Diagnostic Industry 21, no. 10 (1999): 120–126.
3. MH Scholla, "A Potential Method for Specification of Microbial Barrier Properties" (paper presented at the Birmingham Medical Device Technology Conference, Birmingham, UK, February 2000).
4. BYH Liu, "Aerosol and Particle Measurement," University of Minnesota.
5. NA Fuchs, The Mechanics of Aerosols (New York: Pergamon Press, 1966).
6. ASNT Nondestructive Testing Handbook on Leak Testing, vol 1, 2nd ed, (1982).
Earl T. Hackett is technical marketing associate and Michael H. Scholla is global business manager at DuPont Medical Packaging (Wilmington, DE). Stasys Rudys is technical services manager and John Bletsos is new products manager at DuPont Medical Packaging (Richmond, VA).
Photo by Roni Ramos
Back to the MDDI August table of contents | Back to the MDDI home page
Copyright ©2000 Medical Device & Diagnostic Industry
You May Also Like