Sign up for the QMED & MD+DI Daily newsletter.
TESTING Residual stresses and molecular orientation throughout a product provide important information about how that product will perform. The presence or absence of residual stresses is a major concern in the production of plastics for applications such as medical devices and packaging, instrument manufacturing, optical components, and others.
11 Min Read
.svg?width=850&auto=webp&quality=95&format=jpg&disable=upscale "Measuring Residual Stress In Transparent Plastics")
Residual stresses are introduced by nearly all techniques used for polymer manufacturing. They form as a result of extrusion, stretching, drawing, molding, casting, joining, or other strain-inducing processes. Strains can be introduced by differential shrinkage, uneven cooling, or nonuniform flow.
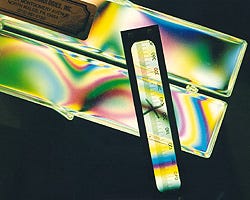 Stress evaluation can be quantified using a compensator. Photo: Strainoptic Technologies.
In some polymers, the process-induced orientation enhances mechanical properties. For example, biaxial orientation of PET or polystyrene film ensures improved strength and formability.1 In other instances, residual tensile stress must be avoided, since the surface develops chemical susceptibility and cracks will occur in the presence of solvents and detergents. This is of particular concern to manufacturers of medical devices or containers for pharmaceutical products.
In a production environment, processes can change for a variety of reasons. Subtle increases in production rates or changes in cooling rates, temperature, or material composition can cause new problems. Inspectors may find, for example, that molded polystyrene products warp or twist within a short time after emerging from the press, that machined acrylic surfaces crack, that oriented film can't be drawn without cracking, or that products discolor.
These types of problems can often be traced to residual stresses or stress relaxation. Residual stresses must be evaluated at every stage of the product cycle, from product design to full production. By carefully monitoring stresses, process and quality controllers help maintain both product quality and productivity, using direct measurements to assess the suitability of various approaches to eliminate undesirable stresses or to induce beneficial ones. The uniformity and distribution of stresses in a product must also be carefully evaluated.
While the effects of stresses in various materials are often reviewed and discussed, the methods and instruments available to evaluate stresses are not always well known or understood. Several methods are currently available to evaluate residual stresses in plastic parts. Users must first choose between destructive and nondestructive methods. Most destructive methods are time-consuming, hard to use, difficult to interpret, and incapable of providing quantitative information for comparative purposes. For nontransparent plastics, choices are limited to destructive tests such as layer removal, section removal, and stress-corrosion tests.
 Figure 1. Schematic illustrating the principle of polarized light transmission. S1 and S2 represent the principal stresses at a point, and R is the retardation between vibration along S1, S2.
For transparent plastics, nondestructive methods offer the better choice. The methods discussed in this article apply the concept of photoelastic response of transparent materials, which has been known for well over a hundred years. Brewster's Law states that the index of refraction in a strained material becomes directional, and that the change of the index is proportional to stresses. Plastic processing methods orient molecules and introduce birefringence--an orientation in the index of refraction--that can be effectively used for quality control.
MEASURING BIREFRINGENCE
Birefringence, or optical anisotropy, is related to the elastic stresses and orientation release stresses that prevail in oriented polymers (see Figure 1), so that
(n1 n2) = C (S1 S2) ,
where n1 n2 is in-plane birefringence, C is the material stress constant obtained from existing tables or by calibration, and S1 S2 is the difference in orientation stresses. As a result of the relative difference in their velocities, polarized rays vibrating in planes of principal stresses S1 and S2 will emerge with a relative phase shift and produce color interference fringes or multicolored bands. After crossing a thickness t, the relative retardation R between two polarized rays becomes
R = t (n1 n2) = C t (S1 S2) .
Measuring the retardation R thus allows for the measurement of the birefringence at any desired location, so that
(n1 n2) = R t = C (S1 S2) .
 Table I. Color versus retardation.
QUALITATIVE EVALUATION
The most basic way to look at stresses in clear plastics is to place a sample of the material between two illuminated polarized sheets. When these elements are properly aligned, the stress pattern becomes visible. In some cases, the color fringes can be used to evaluate birefringence, since each color band correlates to the degree of stress in the inspected sample. A color-versus-retardation chart is used to interpret the observed pattern (see Table I).
In a great majority of applications, the color pattern is difficult to interpret and can be misleading, since a "red" or a "green" fringe could be observed at multiple stress levels. However, this method can be very useful for a simple identification of maximum stress areas. Today's quality control requirements, however, generally call for precise, reproducible, quantitative measurements that cannot be satisfied using this basic approach.
QUANTITATIVE MEASUREMENTS
Birefringence is easily measured quantitatively, and both off-line and on-line instruments are available to ensure product quality and maintain production uniformity. The type of instrumentation selected largely depends on the application, degree of accuracy or reproducibility required, and level of operator skill.
Measuring birefringence can be accomplished using a "compensator," a calibrated, graduated wedge that is placed in series with the measured item. The operator adjusts the wedge until a black fringe appears at the point of interest, as shown in the photograph on page 16. The black fringe becomes visible when the retardation in the compensator is equal and opposite to the retardation at the point of interest in the sample. A scale then supplies a quantitative reading. Measuring with a compensator is a standard ASTM test procedure2 and is a particularly effective laboratory tool for quality control of clear plastics. This method is usually preferred over the so-called "Senarmont" or "analyzer rotation method," which can be difficult to learn and even more challenging to apply to high-stress products.
PC-BASED INSTRUMENTATION
In today's industrial environment, quality production is required for survival. This is particularly true in the field of medical plastics. In most companies, quality production dictates not only an ongoing upgrade of QC procedures, but also standardization of practices, calibration of measuring tools, and extensive training of personnel.
 Figure 2. PC-based spectral contents analyzer system.
The use of PC-based methods for measuring stress helps simplify the implementation of quality control procedures. In particular, these methods can reduce the need for skilled operators and provide far greater speed, consistency, and precision. QC automation also offers a means to record and store measurement files for retrieval and to analyze trends over time.
Measuring can be greatly facilitated when a PC-based sensor is coupled with spectral contents analysis (SCA). This technique works similarly to ordinary visual observation. First, polarized light is passed through the sample to be analyzed. A scanner replaces the human eye, and channels light through a fiber-optic cable to a spectral contents analyzer spectrophotometer, as shown in Figure 2. The transmitted light intensity I is related to both retardation R and wavelength *i :
Ii=(I0)(sin2)(¼R *i ).
Measurements of the transmitted light intensity are processed at multiple wavelengths *i, allowing for high-speed, totally automated measurements of retardation that are conveniently independent of the direction of stress.3 Readout is nearly instantaneous, and can be reported for any selected point or along a scanned line.
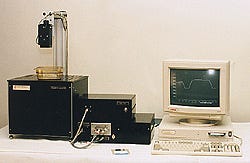 Figure 3. Off-line PC-based SCA stress scanner.
Figure 3 illustrates an off-line measuring station using the SCA method; this type of system can also be installed on-line. For on-line installations, scanners can be mounted on a carriage as part of a linear-motion system, registering measurements across sheets, film ribbon, molded test samples, or finished parts. After scanning an item, SCA systems show a graph of results (see Figure 4) that can be printed or stored. Reporting is immediate, making real-time process control a reality.
 Figure 4. Retardation-versus-position graph produced with an SCA stress scanner.
MEASURING BIAXIAL ORIENTATION
In biaxially oriented products--such as blown tubular geometries or films produced by stretching in two directions--orientation stresses (S1 and S2) can be very large, but the difference (S1 S2) can be very small or even zero, leaving the in-plane birefringence (n1 n2) very small. This presents a challenging measurement situation.
Methods of measuring birefringence in biaxially oriented materials have been developed by Stein, Redner, and Drucker.46 In these methods, light crosses the material at an angle, yielding birefringence in an oblique plane. Combining the retardation measured in the normal and oblique paths will yield both in-plane and out-of-plane birefringence.
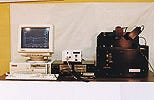 Figure 5. PC-based stress scanners for biaxially oriented materials measure retardation in both normal and oblique paths.
On-line and off-line scanners for QC of biaxially oriented films usually contain both normal and oblique light paths, combined with orientation-angle measurements.7 Figure 5 shows an example of an off-line SCA measurement system for biaxially oriented film.
INSPECTION OF ANNEALED PARTS
Materials like PMMA, optical elements, or other annealed plastics exhibit very low birefringence activity and thus require a different approach. For these materials, measured birefringence in a thoroughly annealed sample can be smaller than 2 * 10-6. Even a small level of birefringence hampers optical properties and product performance.
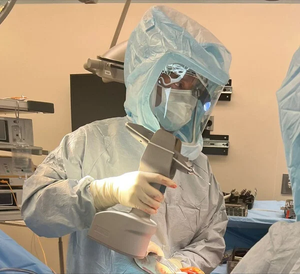
The annealing processes must be carefully and frequently monitored to ensure that residual stresses do not exceed tolerance limits. This is particularly true of plastic materials of varying thicknesses or strong curvature. Undesirable stresses can also develop in machined parts. Similarly, stress concentrations around seals or welds can cause product failures, and therefore must be closely monitored (see Figure 6).
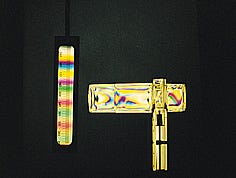 Figure 6. Examination of joint, seal, and weld stresses in a medical device.
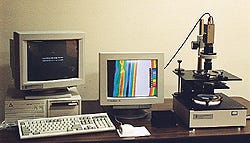 Figure 7. PC-based digital image analysis system.
Visual methods for inspecting annealed parts often include a microscope and compensator. For this type of inspection, a PC-based system using digital image analysis of the photoelastic image is preferred. Such a system offers consistent, precise, automated full-field inspection, with a maximum range of approximately 300 nm. The system acquires a full-field image of the inspection area using a polarimeter setup and a CCD camera with the appropriate magnification (see Figure 7). The CCD camera captures the image produced by the polarimeter. A computer-based frame grabber splits the image into 512 * 512 measurement points (pixels), and the light intensity of each point is measured. This light intensity is related to the retardation R and to the source intensity I0, so that
I=(I0) (sin2) (¼R *) + IB ,
where IB is the amplifier zero or background, measured in absence of the specimen. Quantitative measurements are automatically computed by the system, and the operator selects the desired output format. Measurements can be reported for a single point or along a line, or a full-field stress map can be selected for output. Each color of the full-field stress pattern corresponds to a narrowly defined stress range.
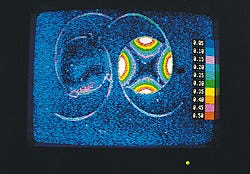 Figure 8. Comparing residual stress in two copolymers using digital image analysis.
Figure 8 shows a digital image analysis system full-field stress map comparing residual stress in lenses produced from two different copolymers. Useful in product development and materials analysis research, this type of system is also effective for day-to-day quality control; when supplied with a pass/fail software feature, operators can quickly and easily identify reject items. Inspection of this kind is also used to examine seals and welded joints between the same or different annealed materials.
CONCLUSION
Whatever the instrumentation or method used, the inclusion of stress measurement in QC procedures should be fundamental in monitoring, identifying, and fixing stresses before parts fail. When stresses are identified, a variety of processing changes can be evaluated to improve product performance. The amount of residual stresses may point to one solution, while the distribution of stresses may suggest other required processing alterations. Depending on the production method, changes in material, temperature, cooling rates, airflow, gate placement, part thickness, and numerous other factors will cause variations in residual stresses or their distribution throughout a plastic part.
When the perfect processing combination is identified, defects are substantially reduced. Parts will maintain optical clarity, stability, and resistance to environmental stress factors. Whether a manufacturer is simply putting together a design concept, developing prototypes, or in full production, a commitment to inspection of residual stresses will greatly contribute to product quality and consistency.
REFERENCES
1. Bakerdjian Z, "Preparation of Balanced HDPE Blown Films," SPE Technical Papers, 23:452454, 1977.
2. Standard Test Method D 4093-95 for Photoelastic Measurement of Birefringence and Residual Strains in Transparent or Translucent Plastic Materials, West Conshohocken, PA, ASTM, 1995.
3. Redner AS, "Photoelastic Measurement by Means of Computer-Assisted Spectral-Contents Analysis," Experimental Mechanics, 25(2):148153, 1985.
4. Stein RS, "Measurement of Birefringence in Biaxially Oriented Films," Journal of Polymer Science, 24:383386, 1957.
5. Redner AS, "A New Oblique-Incidence Method for Direct Photoelastic Measurement of Principal Strains," SESA Proceedings, 21(1):6769, 1963.
6. Drucker D, "The Method of Oblique Incidence in Photoelasticity," SESA Proceedings, 12:5160, 1955.
7. Redner AS, "Measurement of Biaxial Orientation and Orientation Release Stresses in Polystyrene Film Production," International Conference on Photoelasticity Proceedings, Kent, UK, Sira Communications Ltd., pp 124127, 1993.
With more than 35 years' experience, Alex S. Redner is an authority in the field of residual stress analysis. He is president of Strainoptic Technologies (North Wales, PA), which is dedicated to researching and developing new methods of measuring residual stress in addition to manufacturing stress-measurement instrumentation. Barbara R. Hoffman is director of sales and market development at Strainoptic.
Copyright ©1997 Medical Plastics and Biomaterials
About the Author(s)
You May Also Like