Key Challenges to Continued Success
Lack of Focus. As a result of the ongoing acquisitions and continuing investment in R&D, many firms struggle to continuously define and refine what they are and their core focus. There is a steady stream of spin-outs or sell-off of divisions, subsidiaries, or business lines that are perceived as no longer fitting with the core strategy of the firm. The result is ongoing trading of business units between the major and mid-tier players; examples include Boston Scientific selling off its cardiac and vascular surgery businesses to Getinge in 2007, the further sale of the Boston Scientific Neurovascular division to Stryker in January of 2011, and the Abbott spin out of Hospira in 2004. This corporate restructuring allowed Abbott to focus on pharmaceuticals, and the medical supply business of nonpatented products was spun out as a stand-alone corporation. In another recent move, Medtronic announced plans to spin out its defibrillator business, comprising the Physio-Control division; this is a second attempt to spin out the division after the first attempt failed following the 2006 FDA recalls on the product line. Tyco Corp., following their CEO governance scandals in 2002, spun out their medical products organization in 2007 to form Covidien as a stand-alone business; it ranks 10th on the BioMed 25 list for 2010 revenues.
High Rate of M&A. One downside to the extensive practice of growth and extension by acquisition is that many small plants get picked up and added to an existing infrastructure. Often those plants are located next to the R&D teams that develop and push the products into the marketplace. The result can be a mish-mash of small facilities, each with its own overhead, management, and cost structure, often spread out at locations that make no sense for optimal product distribution and have high labor costs. The need to co-locate manufacturing work with product development leads to additional challenges. While plants and manufacturing functions can be moved for parts and technology manufacturing, it is much harder to move a research staff and keep intact its intellectual core. As a result, some firms have been reluctant to address the inherent inefficiencies of their physical structure and personnel locations, because a move often causes severe losses of important intellectual capital.
However, a counter pressure that emerges is the need to host key customers for education and training at a centralized, key campus. A core component of the marketing is training the doctors and other medical professionals on how to use and deploy the products. However doctors will not travel to many small facilities; it makes more sense to build one central research campus with a co-located education facility. Terumo has made major investments in its Japanese home market education facilities; B. Braun has made similar investments in its core campus in Melsungen, Germany.
In response, many firms have launched restructuring plans to consolidate facilities for both manufacturing and research. Medtronic launched a One Medtronic campaign in 2008 to reduce the number of locations and trim duplicative headcount, both in the U.S. and key European markets, recording charges of $742 million in 2008, $1 billion in 2009 and $374 million in 2010. Boston Scientific, a serial acquirer in earlier years, has launched several rounds of restructuring to reduce plant locations, in addition to its serial sales of divisions to competitors. Baxter restructured product lines and facilities in 2005 that set the base for profit growth through the Great Recession. A review of the facilities and locations supporting other firms in the Top 25 reveals ample opportunity for rationalizing and optimizing manufacturing and distribution facilities and research locations.
During early 2011, the BioMed Top 25 was reshaped by major M&A activity. Looking to diversify into medical products and reduce its dependence on a shrinking drug pipeline, Swiss pharmaceutical giant Novartis acquired Alcon. Johnson & Johnson, after a rumored pass at Smith and Nephew, closed on the acquisition of Synthes. Within the Top 25 list, Danaher Corp. added to its base of instrument and technology businesses by acquiring Beckman Coulter. With the closing of these acquisitions, the BioMed Top 25 will shrink to the Top 22.
One company stands in contrast to the growth through acquisition and expansion strategy. Terumo, using Japanese GAAP for reporting, draws revenue from two primary lines—a variety of general hospital products including disposable devices, infusion pumps, continuous ambulatory dialysis, and hemodialysis care items, for 47.4% of revenue; cardiac and vascular products that include vascular grafts, and related neurological and cardiovascular systems, comprising 43% of revenue; and a variety of blood transfusion and processing systems, making up 8% of revenue. While 55% of its 2009 revenue came from Japan, the European market comprised 17% and the Americas 18% of revenue, with the balance from the rest of Asia. Growth was strongest in the home Japanese market (+7.3% year to year), compared to essentially flat revenues from Europe. Terumo manufactures its products regionally, with core manufacturing and pilot production in Japan. Local production takes place in factories in the United States and Europe, and new investments are strengthening manufacturing in China. In contrast to the U.S. and European firms that have boosted growth by acquisitions, Terumo has driven its growth through organic extension of existing product lines and addition of new products driven by internal R&D, complemented by new offerings from joint development partnerships with peer Japanese firms such as Olympus Medical Systems. The customary exchange of cross-shareholdings that mark a Japanese partnership left Terumo as the largest single shareholder in Olympus at the time of the recent discovery of long-hidden losses and irregular dealings that has materially damaged the value of the Olympus investment.
|
Figure 1. Sales & Marketing expenditure levels. Click figure for larger image. |
Key Characteristics Lead to Success
Increased Marketing Efforts. The high and increasing levels of marketing expenditures are a notable feature of the biomedical device sector, which increased from a 26.2% of revenue to 27.5% of revenue across the five years from 2006 to 2010. Furthermore, the aggregate dollars spent grew by 59% over the time period, against revenue growth of 48% (see Figure 1). Marketing expenses usually decline as revenue and volumes increase and efficiencies of scale begin to kick in. Thus when marketing expenses grow faster than revenue, something unusual is afoot—either a massive and mutually self-destructive foot race to grab share is underway, or something about the nature of the business is causing firms to invest more in marketing and sales. There are very few businesses that spend as much on marketing and sales as the biomedical device industry. In contrast, the IT business, generally noted for making complex products requiring long sell cycles, spends only 15% to 20% of revenues on sales and marketing.
Why is marketing and sales expense so relatively high? In general the nature of the products and services offered demands a high touch level in the selling process. Almost all the firms in this business heavily use high-cost direct sales forces, working in high-cost markets with little opportunity for extensive productivity gains. A few use distributors for products in some more remote developing markets, but one theme between many companies is the steady stream of acquisitions of partners or distributors as they grow their presence to reach sustainable levels in new country markets.
In the selling process, individual medical specialists, often doctors, surgeons, and their support teams must be met, convinced, coached, and trained to use the products. Many firms invest heavily in education, bringing doctors to seminars and training sessions, and vice versa; some have invested in training facilities and supporting staff. Further expenses are incurred for consulting fees, to fund doctors who have used the products to exhort and train other doctors to join them as users. Key hospital staff must also be contacted, cajoled, encouraged, and entertained. We have referred to the costs of this highly hands-on marketing as an investment because it so expensive and intricate, with benefits so far beyond the current period that, although accounting may treat these as items to be immediately expensed in the current period, the clear reality is that the multiperiod payback makes these sales and marketing activities more of an intermediate term investment.
In reaction to the practices of this sector and the pharmaceutical sector, some medical schools have begun to either ban their faculty from accepting drug and biomedical device consulting contracts, or forced them to disclose the extent and nature of their support. Similarly, some firms post the names and amounts paid to consulting physicians and other researchers online. These actions may slow the escalating arms race of sales expenditures, but they are unlikely to materially lower the level of spending relative to sales.
Some firms have made particularly large increases in their ongoing investment in sales and marketing:
Covidien increased sales and marketing spend by 9.3 percentage points from 2006 to 2010, a 55% increase in dollars spend against a 6% increase in sales. The cause is a shift in product mix from lower margin, lower sales touch pharmaceutical products to a new set of medical devices for bariatrics and hernia repair, which required a more hands-on sales approach. As a result, the company hired about 2000 sales representatives between 2007 and 2009.
Tornier also increased its sales and marketing spend by 9.1 percentage points, from 46.7% in an early start-up year to an astonishing 55.8% of revenue in 2010.
Zimmer Holdings increased S&M spend by 6.9 percentage points to 41.6% of sales in 2010.
However, some firms managed to cut their percentage spend on S&M:
Wright Medical Group cut from a high level of 56.8% of sales to a 54.4%, for a 2.4 percentage point cut in relative spend.
CR Bard cut spend from 31.1% in 2006 to 27.9% in 2010, a savings of nearly 3.1 percentage points over the period, based on the realignment and restructuring of their non-U.S. marketing functions in 2009. Relative to its medical device peers, Bards sells a large share (33%) of products primarily through distributors.
There is logic to the high levels of marketing spend, which can be demonstrated by grouping the S&M spend into relative brackets and then looking at the product-market strategies for firms in the bracket (see Table II).
Very High: 40% to 55% of revenue spent on S&M. This includes (at 2010 levels) Smith & Nephew (46.9%), Tornier (55.8%), Wright Medical (54.4%), and Zimmer (41.6%). The common thread here is that these firms focus on joint replacement products, for core body joints (hips and knees), or extremities (wrists and ankles); and all have high costs for selling to, training, and supporting surgeons.
Medium High: 20% to 40% of revenue spent on S&M. This larger group includes, inter alia, Abbott Labs (29.5%), Alcon (28.8%), Baxter (22.6%), Beckman Coulter (30.2%), Biomet (38.6&), Boston Scientific (33.1%), Getinge AB-B (21.5%); Medtronic (34.2%), etc. This group contains firms with complex products that demand a high-touch sales approach to reach heart surgeons and internists, but not the ultrahigh expense levels required to reach and support orthopedic surgeons.
Medium Low: 5% to 20% of revenue spent on S&M. This smaller group includes Varian Medical (14.2%), Hospira (12.2%), and Fresenius (16.7%). These companies either sell lower-value services along with devices and consumables, and also sell them to labs, nurses, and other medical users, or go to market through distributors with higher volume, lower margin products where the system element is sold by its sales force. The high-dollar revenue consumables move through the distributors (e.g. Hospira).
The common elements here are that the level of marketing spend required is set by the earning power of the key decision maker and the time and effort required to reach and influence the decision makers to favor and use a particular firm’s products.
The larger question raised by this high level of sales and marketing expenditure—Are these businesses technology focused, or are they focused on the customer? These businesses invest a lot in R&D, and it is a critical factor facilitating their ability to keep up in the marketplace. But it is also increasingly clear that their customer is the medical professional who makes decisions about which brand or product to use for which application. The acquisition strategy for many firms in this business is to complement their existing offerings with complementary products targeted to extend their array of offerings to the medical professional they already reach, or to those closely related. In short, the high cost of marketing is, for many firms, driving the strategy for growth and acquisition as they search for more products to sell to the same decision makers, in the search for improved sales efficiency.
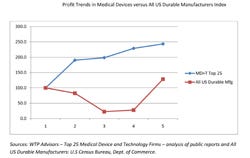
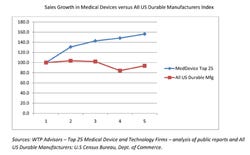
Strategic Development: Winners and Losers. There are some clear winners and losers to be found in this group. The following companies are the best performers (see Figures 2 and 3):
Abbott Labs leads with top profit growth, up 169% from 2006 to 2010, on revenue growth of 56%, based in part on the performance of its biomedical device businesses that focus on cardiac stents and related vascular instruments, and in diagnostic products.
Fresenius grew profits 83% over the five-year period, on a 32% revenue gain, based on extending its sales of consumables and devices to the dialysis service centers.
Alcon grew profits by 64% on revenue gains of 47%, based on extending sales of devices and consumables for eye surgery and care.
|
|
Figure 2. Profit trends in medical devices versus all U.S. durable manufacturers index. Click figure for larger image. | Figure 3. Sales growth in medical devices versus all U.S. durable manufacturers index. Click figure for larger image. |
The following companies were poor performers that either reduced profitability or sustained losses:
Biomet, taken private in 2007, was saddled with a large load of debt in a sector that usually runs on low or no debt, and struggled to cover interest charges and pay down debt. With revenues up 19% from 2006 to 2010, profits declined some 323%.
CareFusion, spun out of Cardinal Health in 2008, saw low revenue growth from 2007 to 2010, and a profit decline of 66% on the costs of transitioning to a stand-alone company after the spin-off from Cardinal, and the expiration of one-time tax benefits that will raise tax rates going forward.
Terumo, based in the slow-growing Japanese home market, saw the lowest revenue growth in the group, a mere 14% from 2007 to 2010.
Finally, the perennial loser of the group is Boston Scientific, which lost money in all five years from 2006 to 2010, and after several ill-fated acquisitions (Guidant) and divestitures to Getinge and Stryker, saw essentially flat growth in revenues and a 70% decline in annual profits.
Next: Future Risks and Dangers
Yair Holtzman is director and global life sciences leader at WTP Advisors (White Plains, NY). Tom Figgatt, Sr., is an associate at the firm.
About the Author(s)
You May Also Like
