Originally Published MDDI December 2005 2005 MEDTECH SNAPSHOT
December 1, 2005
Originally Published MDDI December 2005
2005 MEDTECH SNAPSHOT
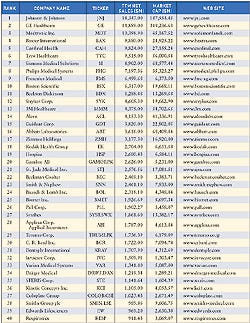
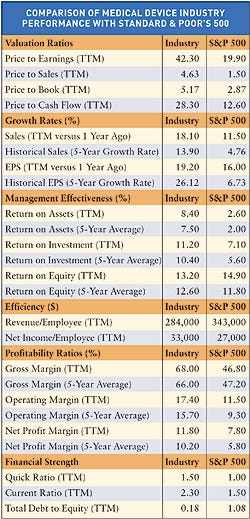
Net income slowed for several device companies, including Boston Scientific, in 2005, according to Merrill Lynch. The charts on these pages provide a look at the financial health of the device industry. Indicators include a chart comparing industry performance with Standard & Poor's 500 and the top 40 public medical manufacturers worldwide, ranked by revenue.
|
|
Copyright ©2005 Medical Device & Diagnostic Industry
You May Also Like


