Medical Device & Diagnostic Industry MagazineMDDI Article IndexOriginally published October 2000Salary Survey Try the 2000 Interactive Salary Estimator
October 1, 2000
Medical Device & Diagnostic Industry Magazine
MDDI Article Index
Originally published October 2000
Salary Survey
Try the 2000 Interactive Salary Estimator |
In addition to comprehensive insurance packages, more medical device companies are now offering stock options, education benefits, performance bonuses, and pension programs to employees.
Gregg Nighswonger

General and Corporate Management
Marketing
Product Design Engineering
Production and Manufacturing
Quality Assurance and Quality Control
Regulatory and Legal Affairs
Research and Development
Medical device and in vitro diagnostics professionals are enjoying salaries that are nearly 3% more than last year's, based on results of MD&DI's 12th annual salary survey. In addition, average total compensation was approximately 5% higher than last year, and 57% of all respondents received bonuses in the 12 months prior to the survey. These results appear consistent with a nationwide trend recently discussed by management consultants Hewitt Associates (Lincolnshire, IL). Hewitt suggests that most industry professionals will continue to see modest salary increases in 2000 and 2001; however, variable compensation plans, such as performance-based bonuses and stock options, will grow markedly. For the companies involved, such plans are viewed as being a win-win proposition since they are not generally a fixed cost but rather a "self-funding plan" that provides added compensation when specific business goals are met. Hewitt has found that medical device companies are among the industries now embracing variable compensation concepts.
A TYPICAL RESPONDENT AND CHANGING CORPORATE PROFILES
The MD&DI annual salary survey is intended to provide a statistical representation of the magazine's current readership—providing a glimpse of the average professional who works full time for either a medical device or in vitro diagnostics manufacturer. Although the typical respondent has changed only slightly from last year, the level of business activity at companies represented by this year's respondents varies in several regards.
Most respondents (86%) are employed by organizations that produce medical devices only; 7% work for manufacturers making only in vitro diagnostics; and 7% are employed by firms producing both. These percentages represent little change since last year. The typical respondent to the 2000 salary survey is a white male, who is 43.8 years old. He holds a bachelor's degree, usually works 50 hours a week, supervises 4.9 employees, earns $77,000 annually, and received a 7.7% salary increase with his last raise. He has worked for the same company for about 8 years and has been involved in the industry for nearly 12 years.
The most significant changes in this year's corporate profile are related to size. For instance, the median number of full-time employees at these companies (including all locations) was reported to be 340. This represents a decrease of 23 employees from results reported in last year's survey. A greater difference was noted in reported sales volume. The typical company this year reported a median 1999 sales volume of $74.6 million, which represents a sizable decrease from the $100 million reported last year. It is more consistent, however, with the average sales volume reported in the 1998 survey, which was $68 million.
THE NATIONWIDE VIEW
On average, salaries made up 76% of the value of respondents' reported total compensation packages. The average salary reported for 2000 was $77,000—a 3% increase over the average salary reported in 1999. In addition, 85% of all respondents indicated that their organizations offer annual salary reviews, and 83% reported receiving raises from their current employers. Nearly two-thirds of all respondents indicated that their last raise was not the result of a promotion or change in job responsibilities. The average salary increase among all respondents receiving raises was 7.7%, significantly more than the 6.8% reported in 1999.
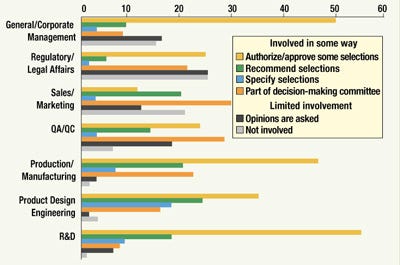
Figure 2. Levels of reported decision-making influence in the selection of suppliers.
Health, dental, and life insurance continue to be the most common benefits received by respondents. This year, however, a larger percentage of employers began offering stock options, education benefits, and pension plans. The average value of respondents' personal total compensation package reported this year was $101,000. Among the 57% of all respondents who received bonuses in the past 12 months, the average amount reported was $11,000.
Industry Average $77,000 $101,000
Production/Manufacturing | $67,500 | $85,000 |
QA/QC | 71,300 | 92,000 |
Product Design Engineering | 75,300 | 98,000 |
Marketing | 78,200 | 99,000 |
Regulatory/Legal Affairs | 81,800 | 111,000 |
R&D | 81,800 | 117,000 |
General/Corporate Management | 99,400 | 130,000 |
Figure 3. Average salaries are showen in green, average total compensation in blue.
Respondents' satisfaction with their current employers appears to be relatively high again this year—3.8 on a 5-point scale in which 5 represents "very satisfied" and 1 represents "not at all satisfied." These results are the same as last year's and tend to reflect the respondents' job-seeking status. Most respondents, 59% nationwide, are not presently considering a new job outside their current organization. Thirty-one percent indicate that they are strongly considering a job search; however, only 9% indicated that they are actively looking. These results have also changed little from those reported last year.
As illustrated in Figure 1, the West led the other regions in total compensation ($114,000) and average salaries ($81,700); the South reported the highest salary increases (9.0%). The Midwest ranked fourth this year in average salaries ($69,900) and total compensation ($88,000), and in salary increases (6.9).
INFLUENCE ON DECISION MAKING
Respondents reported a considerable degree of involvement in the decision-making processes used by their companies to select suppliers. Overall, 56% of the respondents either authorize, approve, or recommend suppliers. More than 90% indicated that they have at least some degree of involvement in the decision-making process—ranging from opinions being asked to approving materials, components, or suppliers. Figure 2 examines the relationship between specific job categories and the respondents' levels of influence on purchasing decision making. Because increased job responsibilities generally suggests a greater level of decision-making influence, it is not surprising to find that the average salaries of respondents who approve vendors is $19,500 more than those who do not, and $12,200 more than the current nationwide average.
PERSPECTIVES ON SALARY LEVELS
A great number of factors will influence the actual salary received by an individual. Corporate philosophy, competition within a given job market, and the local or regional business environment can all affect the salary levels offered by a company. Because these factors are beyond the scope of this project, MD&DI's annual salary survey focuses on measurable salary influences. These include job category, region, education level, years of experience in the field and years of employment with the current organization, and gender.
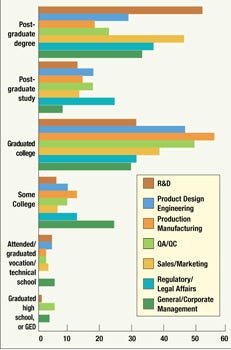 Figure 4. Education levels by job category.
The most significant factor in determining salary levels is almost always job function (see Figure 3). Individuals in upper management, for example, typically have significantly higher levels of compensation than those in other job categories. From highest to lowest, the ranking of job functions this year, based on average salary, were general and corporate management, research and development and regulatory and legal affairs, marketing, product design engineering, quality assurance and quality control personnel, and production and manufacturing.
Both age and experience also weigh heavily in determining salary. Respondents under 35 years of age were found to earn $57,400 on average, significantly less than the $77,000 national average. Those 55 years and older earned salaries that were $20,800 more than the average annual salary. Those with 10 to 14 years of experience with either medical device or in vitro diagnostic manufacturers earn an average salary of $78,300, $1300 more than the national average; however, the average salary of respondents who have been in the industry for 15 or more years is $15,800 above the national average.
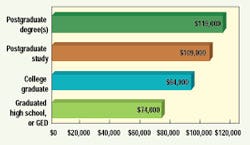 Figure 5. Relationship betweeneducation and salary levels.
With regard to the influence of education and gender, average respondents holding postgraduate degrees were found to earn $19,600 per year more than those holding a bachelor's degree alone (see Figures 4 and 5). The average annual salary earned by respondents with only high school diplomas or GEDs ($57,500) was $19,500 less than the national average. Male respondents earn $1900 more than the national average, and $11,100 more than typical female counterparts. It should be noted, however, that this does not account for such underlying differences as experience and job responsibilities.
RESPONSES BY JOB CATEGORY
The following pages provide greater salary and compensation details concerning each of the seven job categories included in the survey. The categories included are: general and corporate management, marketing, product design engineering, production and manufacturing (including packaging and sterility assurance), quality assurance and quality control, regulatory and legal affairs, and research and development.
Specific data for each category include median salary and total compensation; average raise and bonus; number of hours worked in a typical week; average length of time with current organization; job-seeking status; and salary averages in relation to gender, years in the industry, number of employees supervised, and company size by sales volume.
This year's salary survey again includes data for median salary levels and median total compensation. The use of median data provides a more accurate look at the actual distribution of salary levels within the field. Because the median value lies at the middle of the salary distribution, half of all reported values are above that level and half are below. They are influenced less by extremely high or low values within the survey population. Mean averages, on the other hand, can provide some indication of salary activity within a given industry, but do not necessarily give the individual a clear indication of how a salary compares with nationwide levels. One exceptionally high reported salary in a population, for example, will yield an artificially high mean value. The generated mean salary may subsequently make a given individual's salary level appear lower than it should.
SUMMARY
Try the 2000 Interactive Salary Estimator |
Results of MD&DI's 12th annual salary survey suggest that medical device and in vitro diagnostics professionals are experiencing modest growth in compensation levels. There appears to be a greater reliance on concepts that tie compensation levels to job or business performance. These variable compensation programs may have a more significant impact in the future.
METHODOLOGY
The data for this year's report were obtained from a mail survey designed jointly by MD&DI and Readex Research Inc. (Stillwater, MN), and conducted by Readex in May of this year. Of the 1375 surveys mailed to medical device professionals, 652 were returned with usable responses—a 47% response rate.
The survey results are based on the responses of 574 individuals who identified themselves as full-time professionals working for companies that manufacture medical devices or in vitro diagnostics. Responses were weighted during tabulation to accurately reflect true population proportions and represent 33,689 MD&DI recipients. Responses were segmented according to the seven job functions outlined earlier as well as by the respondents' level of responsibility as follows: CEOs and presidents, vice presidents and directors, department heads and supervisors, and engineers and scientists.
The margin of error for percentages based on the 574 responses used is ±4.1% at the 95% confidence level.
REPRINTS
The 12th Annual MD&DI Salary Survey is available as a bound reprint, containing a copy of this article, tabular breakdowns for the industry as a whole, and previously unpublished tabular breakdowns for the seven surveyed job functions.
Copies cost $60 each. For more information or to place an order, contact: the Reprints Desk, Canon Communications, 11444 W. Olympic Blvd., Los Angeles, CA 90064; 310/445-4200, fax 310/445-4299.
Gregg Nighswonger is executive editor of MD&DI.
Copyright ©2000 Medical Device & Diagnostic Industry
About the Author(s)
You May Also Like
