Applying Moneyball-style statistical analysis to FDA data yields important insights about the most common pathway to market for medical devices.
December 2, 2014

By Jeffrey N. Gibbs, Allyson B. Mullen, and Melissa Walker
The majority of new medical devices reviewed by FDA enter the market via the 510(k) process. In 2013, FDA cleared approximately 140 510(k)s for every original PMA application approved.
For most medical device companies, it is critical to understand the 510(k) process, evaluate the likelihood of success, and maximize the odds of obtaining clearance. In particular, companies must answer two commercially critical questions:
How long will the process take?
What is the likelihood of success?
As mandated by MDUFA III, FDA calculates and publishes some 510(k) statistics that help make these predictions, including average time to decision and the percent of 510(k)s with additional information requests. These documents provide high-level data on key metrics for a particular fiscal year, but a major limitation is that the calculation of averages will mask product-specific or classification-specific variations. However, the agency has also released information-rich databases that enable far more probing analyses than were previously available. These databases can help companies identify trends that affect timing and odds, and, perhaps, help companies improve the chances of a successful 510(k).
In the book Moneyball, author Michael Lewis explained how the Oakland Athletics exploited new insights derived from statistics to gain an edge in baseball. In the intervening years, baseball sabermetricians have developed esoteric statistics, such as wins above replacement (WAR), that most fans do not understand but which are considered more meaningful indications of a player’s value than runs batted in or batting average. The sabermetricians now have new, more comprehensive data sources available, allowing for yet more refined analysis.1
While 510(k)s and baseball may seem to have little in common (except for the authors’ keen interest in both), they share a common trait: New analytical tools can yield useful insights. In that spirit, we have analyzed the 510(k) program in a new light. Using SOFIE, Graematter Inc.’s Regulatory Intelligence System, we analyzed various 510(k) metrics from FDA’s publicly available 510(k) Premarket Notification Database during the five-year period from 2008 to 2012 to gain insights about this primary pathway to market for medical devices.
Third-Party Reviews Take Longer2
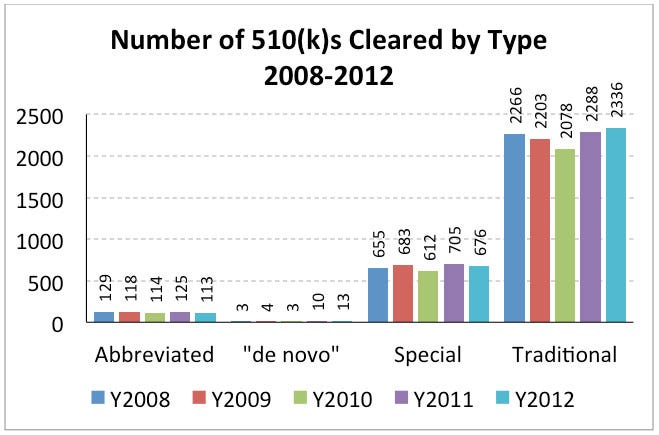
During calendar years 2008 through 2012, FDA cleared approximately 3027 510(k)s per year. The total number and type of 510(k)s (e.g., traditional and special) has remained generally consistent across this five-year period.
Table 1. Submission Types and Overall Percentages 2008 – 2012
Submission Type | 2008 | 2009 | 2010 | 2011 | 2012 |
| ||||
No. | % | No. | % | No. | % | No. | % | No. | % | |
Abbreviated | 129 | 4.2 | 118 | 3.9 | 114 | 4.1 | 125 | 4.0 | 113 | 3.6 |
De Novo | 3 | 0.11 | 4 | 0.1 | 3 | 0.1 | 10 | 0.3 | 13 | 0.4 |
Special | 655 | 21.5 | 683 | 22.7 | 612 | 21.8 | 705 | 22.5 | 676 | 21.5 |
Traditional | 2266 | 74.2 | 2203 | 73.2 | 2078 | 74.0 | 2288 | 73.2 | 2336 | 74.4 |
Total | 3053 |
| 3008 |
| 2806 |
| 3128 |
| 3180 |
|
Figure 1. Submission Types and Overall Percentages 2008 – 2012

The vast majority of 510(k) submissions between 2008 and 2012 were submitted directly to FDA for review. On November 21, 1998, FDA began accepting 510(k) reviews from accredited persons.3 This program has had limited use because only select devices are eligible, and companies have reported mixed experiences with their accredited persons. However, recent data show that the effective rate for the third-party 510(k) review process has steadily declined (from 16% in 2008 to 9% in 2012). There have not been any recent changes to this program, so this decrease appears to be attributable to industry’s disuse—perhaps due to lack of interest, dissatisfaction with the program, and added expense—rather than agency policy.
The seemingly forgotten third-party review program may be an area of interest for industry to explore to try to decrease review times for eligible device types. However, it is worth noting that third-party-reviewed 510(k)s have seen longer review times by FDA, increasing from 46 days with FDA after the third-party has reviewed the submission in 2008 to 62 days in 2012. We have no way of knowing how long the third party took to review the submission (or the quality of the review) before making its recommendation to FDA, but these average review times all appear to be in excess of the 30 days FDA is allowed to make its decision after receiving the third party’s recommendation under Section 523 the Federal Food, Drug, and Cosmetic Act.
Abbreviated 510(k)s Are Not Reviewed Any Faster than Traditional 510(k)s
The overall average review time for a 510(k) between 2008 and 2012 was 137 calendar days. There was an increase in the average review time beginning in 2010, which leveled out between 2010 and 2012. This increase also took place across each of the four 510(k) types.
Table 2. Average Number of Review Days by 510(k) Submission Type
2008 | 2009 | 2010 | 2011 | 2012 | |
Abbreviated | 148 | 150 | 160 | 153 | 173 |
De Novo | 507 | 676 | 751 | 693 | 687 |
Special | 54 | 62 | 73 | 73 | 73 |
Traditional | 128 | 135 | 160 | 168 | 160 |
All 510(k)s | 114 | 120 | 142 | 147 | 144 |
In addition to the overall increase in review time in 2010, the average review times for abbreviated and traditional 510(k)s are essentially the same, with abbreviated 510(k)s actually taking the same amount of time or longer on average than traditional 510(k)s in all years except 2011. This data is particularly curious because when the abbreviated 510(k) was introduced in 1998, the goal was, in part, “to streamlin[e] the review of 510(k)s through a reliance on a ‘summary report’ outlining adherence to relevant guidance documents.”4 While abbreviated 510(k)s may offer advantages in terms of cost and time to prepare, the projected advantage in review times was not realized in this five-year period.
IVD Products Take the Longest to Review
There are no apparent patterns in terms of the number of submissions cleared within and the number of device types (or product codes) assigned to each specialty. But there is a strong pattern in the medical specialties with the highest average number of review days—many of them relate to in vitro diagnostic devices (IVDs). The four medical specialties with the longest average 510(k) review times between 2008 and 2012 were pathology, physical medicine, immunology, and hematology (in decreasing order).
Table 3. Average Number of Review Days for 510(k)s Cleared by Each Review Committee between 2008 and 2012
Reviewing Committee | Average Review Days |
Anesthesiology | 156 |
Clinical Chemistry | 176 |
Cardiovascular | 108 |
Dental | 134 |
Ear, Nose, and Throat | 138 |
Gastroenterology and Urology | 142 |
Hematology | 215 |
General Hospital | 132 |
Immunology | 221 |
Microbiology | 151 |
Neurology | 148 |
Obstetrics/Gynecology | 188 |
Ophthalmic | 171 |
Orthopedic | 121 |
Pathology | 273 |
Physical Medicine | 256 |
Radiology | 92 |
General and Plastic Surgery | 135 |
Clinical Toxicology | 214 |
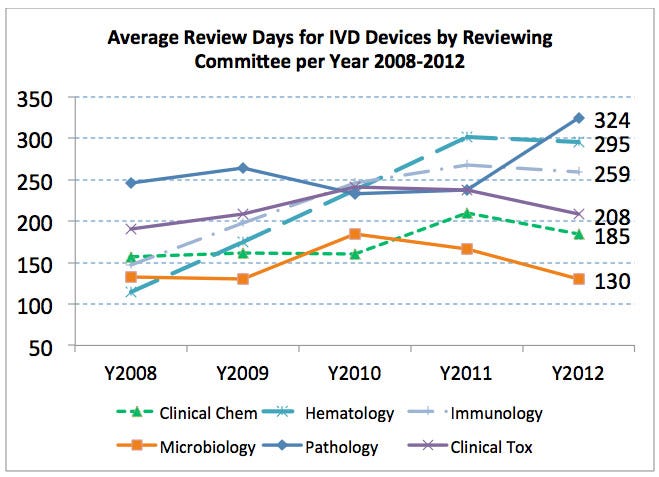
There are six medical specialties that primarily review IVD 510(k)s—clinical chemistry, hematology, immunology, microbiology, pathology, and clinical toxicology. With the exception of physical medicine, all of the medical specialties with the longest average review times were reviewing IVDs. Out of these six medical specialties related to IVDs, four had average review times greater than 200 days from 2008 to 2012, and all six had review times that exceeded the average number of review days for all 510(k)s (137 days) during this time period. The average review times for each of the IVD medical specialties are generally rising or staying the same (even for those medical specialties for which the five-year average was below 200 review days). Overall, the average review time for IVD 510(k)s between 2008 and 2012 was significantly higher than non-IVD 510(k) review times (183 days versus 127 days) (and had increased dramatically since 2003 when it was 82 days).
Table 4. Average Number of Review Days per 510(k) per Year for IVD Medical Specialties
|
|
|
|
|
|
|
Medical Special | 2008 | 2009 | 2010 | 2011 | 2012 | Overall |
Clinical Chemistry | 157 | 161 | 160 | 210 | 185 | 176 |
Hematology | 114 | 175 | 237 | 301 | 295 | 215 |
Immunology | 147 | 198 | 246 | 268 | 259 | 221 |
Microbiology | 133 | 130 | 185 | 166 | 130 | 151 |
Pathology | 246 | 264 | 233 | 237 | 324 | 273 |
Clinical Toxicology | 190 | 209 | 241 | 237 | 208 | 214 |
Overall IVD | 151 | 164 | 194 | 215 | 189 | 183 |
All Non-IVD | 111 | 116 | 137 | 140 | 140 | 127 |
Figure 2. Average Number of Review Days per 510(k) per Year for IVD Medical Specialties

There could be a number of factors behind the longer review times for IVDs, e.g., more new types of devices, more IVDs supported by clinical data, evolving regulatory expectations, etc. The data show, though, that IVD companies should expect longer review times on average than non-IVDs.
This data is particularly relevant because FDA recently proposed imposing premarket review for Laboratory Developed Tests (LDTs), with a few narrow exceptions.5 LDTs are currently run at numerous laboratories in the United States. If FDA’s proposal is finalized, these same review divisions that already see significantly higher review times will be faced with an increased workload. Under FDA’s proposal, the initial LDT submissions will be for higher risk products, which presumably will take more reviewer time than more routine, moderate risk IVDs.
Review Times Change for Products
Average review times for devices change over time. Review times can change more quickly and dramatically for individual types of devices than across the device program or by reviewing committee, even those that are required most often.
Table 5. The Ten Device Product Codes Cleared Most Frequently between 2008 and 2012
Product Code | Total Number of 510(k)s 2008–2012 | Regulation Number | Device Name | Review Time 2008 | Review Time 2012 |
LLZ | 403 | 892.2050 | System, Image Processing, Radiological | 64 | 108 |
GEX | 312 | 872.4810 | Powered Laser Surgical Instrument | 117 | 137 |
HRS | 233 | 888.3030 | Plate, Fixation, Bone | 112 | 137 |
NKB | 225 | 888.3070 | Orthosis, Spinal Pedicle Fixation, For Degenerative Disc Disease | 88 | 104 |
GEI | 223 | 878.4400 | Electrosurgical, Cutting and Coagulation and Accessories | 93 | 156 |
MAX | 214 | 888.3080 | Intervertebral Fusion Device With Bone Graft, Lumbar | 87 | 99 |
DZE | 201 | 872.3640 | Implant, Endosseous, Root-Form | 145 | 224 |
LYZ | 197 | 880.6250 | Vinyl Patient Examination Glove | 113 | 122 |
FRO | 190 | Unclassified | Dressing, Wound, Drug | 153 | 155 |
DXN | 183 | 870.1130 | System Measurement, Blood-Pressure, Non-Invasive | 94 | 118 |
None of the 10 product codes cleared most frequently between 2008 and 2012 saw any decrease in their average review times during that same period. In fact, all of these device types saw an increase (and sometimes a steep increase) in their average review times during this time period. This increase in review times is consistent with the overall average change in review times across all 510(k)s, which saw an increase from 114 review days in 2008 to 144 review days in 2012 (+30 days). (The average review time in 2012 for seven of the 10 product codes was still below the average for all 510(k)s.)
Three of the top 10 product codes saw an increase in their average review times by more than 30 days (the overall 510(k) average), with two product codes, GEI (cutting and coagulation) and DZE (endoscopic implants), seeing increases in excess of 60 days (63 and 79 days, respectively). This pattern is troubling and puzzling. There is no obvious explanation for this trend. With only one exception, there were no device-specific guidance documents issued for these devices between 2008 and 2012. There may have been category-specific events that led to these increases, but this somewhat surprising trend is worth further exploration.
We did another analysis to look at which product codes saw the greatest increase and decrease in their average review times between 2005 and 2012. We limited our analysis to only those product codes that had a minimum of five 510(k) clearances in each year between 2005 and 2012 (thereby minimizing one-off events and outliers). This limitation resulted in a total of 82 product codes. Only six of those 82 product codes saw a decrease in their average 510(k) review times between 2005 and 2012 (approximately 7%). The remaining 76 product codes saw increases in their average review times, which ranged from two days to 157 days. Thirteen product codes saw an increase in their average review times of more than 100 days.
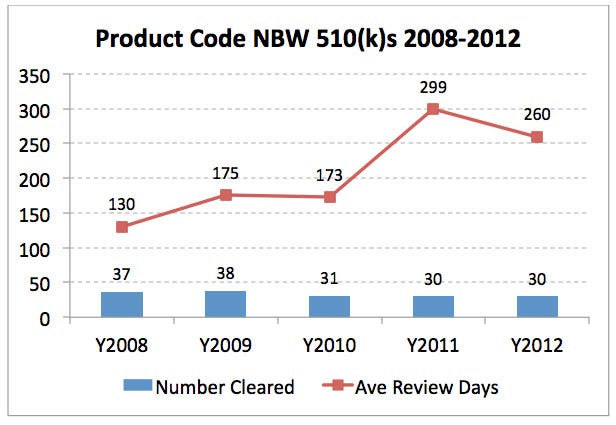
The biggest increase in overall review times between 2005 and 2012 was product code NBW (over-the-counter blood glucose test systems), with an increase in average review time of 157 review days. This increase highlights an important point in our analysis: When there is a safety concern with a particular device type, the review time for the 510(k)s is likely to increase—and in this case, increase significantly. Beginning in early 2010, FDA began considering industry-wide actions to address concerns around the accuracy of blood glucose monitors. FDA clearly changed the requirements for these 510(k)s around that same time when it withdrew the 2006 guidance documents for insulin pump 510(k)s in 2011. This conclusion is reflected in the average review time for an NBW 510(k), which increased by 126 days between 2010 and 2011.
Figure 3. 510(k) Review Data for Product Code NBW (Over-the-Counter Blood Glucose Test Systems)

On the other hand, the biggest winner in our 510(k) analysis was product code FRO (wound dressing). This product type saw an average decrease of 32 review days between 2005 and 2012; nearly all of that decrease was observed between 2005 and 2008 because this same product code saw an average increase of two days in its review times (well below the average increase of more than 30 days) between 2008 and 2012. This variability again reminds us that patterns and trends can change significantly.
Conclusion
There are many ways of predicting how long a 510(k) review will take. Both the overall 510(k) program data and understanding how quickly particular types of 510(k)s have been cleared provide useful insight. Companies will want to draw upon multiple, complementary resources.
In the end, the single most important variable is the 510(k) itself. A well-written, well-supported 510(k) is the sine qua non. Yet, even well-written, well-supported 510(k)s are subject to other forces and trends that can influence the speed with which a 510(k) is cleared, whether relating to the 510(k) program or the specific device.
Baseball teams now hire statisticians to try to gain a competitive advantage. Similarly, carefully analyzing the relevant 510(k) statistical patterns may prove illuminating and advantageous for device manufacturers.
References
1. C. Martrich, "Shifty Business," Orioles Magazine, 2014, vol. 3, at 20.
2. This data is based on the datasets in FDA’s publicly available databases as of August 11, 2014.
3. FDA, "Final Guidance for Staff, Industry, and Third Parties, Implementation of Third Party Programs Under the FDA Modernization Act of 1997 "(Feb. 2, 2011).
4. FDA, "Final Guidance, The New 510(k) Paradigm - Alternate Approaches to Demonstrating Substantial Equivalence in Premarket Notifications" (Mar. 20, 1998), available at http://www.fda.gov/MedicalDevices/DeviceRegulationandGuidance/GuidanceDocuments/ucm080187.htm.
5. 79 Fed. Reg. 59776 (Oct. 3, 2014).
Jeffrey N. Gibbs (a Yankees fan) is a director at Hyman, Phelps & McNamara PC (Washington, DC).
Allyson B. Mullen (a Yankees fan) is an associate at Hyman, Phelps & McNamara.
Melissa Walker (a St. Louis Cardinals fan) is president and CTO of Graematter Inc. (St. Louis, MO)
[Main image courtesy of ADAMR/FREEDIGITALPHOTOS.NET]
You May Also Like
.png?width=300&auto=webp&quality=80&disable=upscale)

