
Sign up for the QMED & MD+DI Daily newsletter.
Medical Device & Diagnostic Industry MagazineMDDI Article IndexOriginally Published March 2001 Experiments reveal that the accuracy of microhardness measurements of test samples depends on the sample preparation technique.Steve Ferry
March 1, 2001
19 Min Read
.svg?width=850&auto=webp&quality=95&format=jpg&disable=upscale "Hardness Testing of Medical Device Components")
Medical Device & Diagnostic Industry Magazine
MDDI Article Index
Originally Published March 2001
Steve Ferry
The medical device and electronics industries manufacture products that are fundamentally different from ordinary hard goods. These high-technology products with critical end-use applications tend to be much smaller and require more-precise tolerances and greater material uniformity. Their materials of manufacture must consistently display the desired properties in order to ensure that the product design meets performance expectations.
Traditional materials-testing methods are not always appropriate for characterizing the components and materials used in medical and electronic devices. Indentation hardness tests are often employed as an economical method of verifying the physical properties of a material, but acceptance testing based only on hardness characterization presents some pitfalls for the manufacturer of high-tech products.
Modern manufacturing demands that materials of construction be inspected as rapidly and accurately as possible. Medical device manufacturers face special challenges in this regard. The typically small size of their components sample imposes particular test limitations. In many cases, the need to accurately characterize the material physical properties of small, high-tech parts dictates that microhardness testing be performed.
Modern manufacturing demands that materials of construction be inspected as rapidly and accurately as possible. Medical device manufacturers face special challenges in this regard. The typically small size of their components sample imposes particular test limitations. In many cases, the need to accurately characterize the material physical properties of small, high-tech parts dictates that microhardness testing be performed.
| Hardness testing gauges a material's indentation resistance. |
However, even microhardness testing can produce less than completely useful results for devices with high-precision requirements when the samples to be tested have been ground and polished. Following a general background discussion of hardness testing, this article presents an experimental investigation into the effects of such sample preparation on hardness-testing results.
HARDNESS AND HARDNESS TESTING
Hardness testing has a very long history. In early times, it was typically performed in order to authenticate a valuable metal or gemstone. One of the earliest standardized hardness scales is the nineteenth-century Mohs' scale, which is based on 10 benchmark minerals increasing in hardness from talc to diamond. Each of these minerals is able to scratch the mineral that precedes it in the scale. To subject another material to this scraping challenge is to perform what is known as a scratch hardness test. Another type of hardness test is associated with machinability, wear, and abrasion. This type of test generally varies from case to case; the methodology is developed so as to provide comparative data under one specific set of test criteria.
Indentation Hardness. Hardness testing as understood today in the field of materials testing measures a material's resistance to indentation under controlled criteria. However, the numerous operative definitions of hardness, the large number of hardness-testing methods, and the various types of hardness-testing equipment make it obvious that hardness is not a fundamental material condition identified uniformly by all techniques. Hardness should be thought of as a composite material property that incorporates other, more fundamental, properties such as yield strength, modulus of elasticity, susceptibility of the material to work hardening, and tensile strength. Hardness testing of one type or another can be performed on any material and is routinely used with elastomers, polymers, minerals, glass, and all types of metals. The hardness of a manufacturing material, as determined by hardness testing, is routinely checked at receiving inspection.
The simplest definition of hardness is a material's quantifiable ability to resist compressive plastic (permanent) deformation. Thus, hardness, as tested in most materials, might more precisely be called indentation hardness. Indentation hardness testing (which is what shall be meant by the term hardness testing in the remainder of this article) is the most commonly performed hardness test. Setting up a test program can sometimes be confusing owing to the complexity of the specifications covering the performance of these tests and the wide range of materials for individual end uses. Hardness tests are made even more complicated by the use of multiple hardness scales and multiple test procedures, as well as by the variety of available test equipment and indenters.
Macrohardness Testing. Bulk materials are usually tested via macrohardness tests such as the Rockwell series. The methodology for Rockwell hardness testing is defined within ASTM E18. These indentation hardness tests involve using a verified machine to force a spheroconical diamond indenter—or a hard steel ball indenter, under certain conditions—into the surface of the material being tested and to measure the difference in depth of the resulting indentations under conditions of preliminary and total test forces (minor and major loads, respectively). This procedure was adopted as an ASTM test method in 1932.
The Rockwell tests most commonly performed are the Rockwell B (HRB) and C (HRC). A diamond indenter with a 150-kg load is used for the HRC test, and a 1/16-in. ball indenter with a load of 100 kg is used for the HRB test. These tests are typically used in characterizing steels, hardened steels, and comparatively hard nonferrous metals. Numerous other combinations of indenters and loads can be employed in Rockwell hardness tests to test polymers, softer metals like copper, and other materials.
Rockwell tests are typically performed because they allow a relatively inexperienced operator to generate accurate data with rapid turnaround. Also, for many materials that have been studied in great depth for as much as a century, tensile strength can be closely approximated by derivation from hardness measurements. Therefore, with a quick and inexpensive hardness test, a material can be checked to determine whether it will meet specifications that include tensile-strength properties. Many design engineers specify a minimum hardness for this very reason.
In macrohardness testing, in order to obtain an accurate hardness reading, an indentation must be a minimum of two indentation diameters from any edge of the sample, and the sample must be a minimum of two indentation diameters thick. This yields an approximate minimum HRB test sample size, when a single indentation is measured, of 5/16 in. diam by 3/16 in. thick. These minimum requirements were arrived at following significant research during the early years of Rockwell hardness test–method development. They reflect the comparatively large indenter area and high test load characteristic of Rockwell testing, along with the need to ensure that the actual sample hardness—and not the hardness of the tester table—is measured. If too thin or small a sample were tested, the indenter would artificially deform the sample or could penetrate it, giving inaccurate test results. Macrohardness testing also requires multiple indentations to achieve statistical significance. These repetitions make a fairly large sample size necessary.
Medical manufacturers are often presented with challenges that severely limit the utility of macrohardness testing. For example, many of the parts they produce are too small to meet the sample-size requirements of such tests, and must be tested with a much smaller indentation.
Microhardness Testing. Macrohardness tests generally involve the use of large indenters—steel balls ranging in diameter from 1/16 to 1/2 in. (the Rockwell diamond brale falls roughly in this range)—and test loads as heavy as 150 kg. Microhardness indenters are typically much smaller, as are the test loads used in such testing.
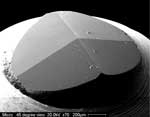 Figure 1. The Knoop microhardness tester features an indenter with an elongated shape that permits multiple test repetitions to be spaced closely together.
The combination of a small indenter and light test load offers great leeway regarding both placement of the indenter on the sample and the volume of material tested. The small amount of material employed in a microhardness test allows multiple indentations to be performed over correspondingly small distances. Traversing-type tests can then be accommodated. These investigate hardness changes within the depth of a cross-sectioned part, or within only a coating layer.
Microhardness tests are used to characterize small parts such as are typically found in medical devices and electronic components. They are also useful for determining coating hardness and hardness profiles of parts. Microhardness testing in today's manufacturing environment involves indentation hardness measurements, not scratch or other types of hardness methodology. Even nano-hardness indentation testing is being studied for its potential utility in materials characterization. It requires an electron microscope for inspection of the indentation.
The two methods of microhardness testing in common use today are the Vickers and Knoop tests. The Vickers microhardness test uses a square diamond to make an indentation. Both diagonals of the indentation are measured, and hardness is calculated from those measurements. The Knoop microhardness tester has a diamond indenter with an elongated shape, and the test requires only a single measurement of the indentation (Figure 1). These hardness tests are based on the same principle as other indentation-type hardness tests: a prescribed load on a defined area will penetrate softer materials more deeply than it will harder materials. Resulting data can be compared material-to-material if samples have been tested using the same method; however, data generated by different test methods are not easily comparable.
The Knoop test, developed by the National Bureau of Standards (now National Institute of Standards and Technology), is the microhardness test most frequently used in the United States. The shape of the Knoop indenter allows test repetitions to be placed closely together. The indentation made is also much shallower than a Vickers indentation, which makes the Knoop test preferable for determining coating hardness and the hardness of thin parts.
PROPER MATERIAL SPECIFICATION
Device designers often specify that a part meet a macrohardness requirement when the part is too small to measure by means of macrohardness test methodologies. They assume that a microhardness test can be performed on the part and the result converted to a macrohardness value. Component and materials suppliers often pre-fer that manufacturers specify a macrohardness value because it is easy for them to determine whether bulk materials meet such specifications.
These practices and preferences have the appearance of useful shortcuts. However, specifying material properties in this manner is detrimental to ensuring that high-quality materials and components are received from a supplier. It is generally not practical to specify bulk material properties using macrohardness references and then confirm final manufacturing results by microhardness testing. Conversion tables relating microhardness to macrohardness scales are approximations and valid only for the material and load that is specified on that chart. Furthermore, the conversions may even be specific to a given heat treatment or single material lot.
When a machine shop receives a raw material, it may use macrohardness testing to verify that the material meets the specified hardness requirements. Then, believing the material to be appropriate, the shop begins to produce parts. This brings to light a key source of error in attempting to correlate macrohardness and microhardness testing results. Many metals work-harden during machining; that is, they have a much different hardness after being processed into a part. The original hardness test result will no longer be valid for such a part, though the supplier may assume that the material of construction is still within specifications.
It is important that designers of medical or electronic products specify material properties that can be directly measured on the finished device being designed, and they should include a microhardness specification. Also critical is to specify the sampling location within the part, the orientation of the area to be tested, and a repeatable sample preparation methodology so that results obtained can be compared among sample groups or manufacturing lots.
Specifications that call for microhardness testing are often internal requirements that are set by a manufacturer and agreed upon by a component supplier. One method that has proven effective in establishing a microhardness specification involves measuring the hardness of fabricated components that have displayed acceptable functionality. A range of slightly variant components can be fabricated in order to determine a hardness range that will be acceptable for the components and that is statistically distinguishable.
DIFFICULTIES ENCOUNTERED IN MICROHARDNESS TESTING
Microhardness testing requires that many important conditions be understood in order for accurate and precise results to be obtained. Common pitfalls associated with microhardness testing involve the following factors.
Component Size. The size and shape of a component can affect testing. A component may require the application of lower loads because samples are too small to withstand the typical testing load. A specimen may not be able to physically support the hardness test load without deflection; samples of this type may need to be fixtured or reinforced. Also, microhardness-testing machines can accommodate only samples within a certain size range. Samples may need to be sectioned if they are too large, or mounted and polished using standard metallographic techniques if they are too small.
Sample Orientation. The sample has to be flat so that the indenter is in contact with the surface evenly. Furthermore, the sample surface to be tested must be perpendicular to the indenter. Samples may need to be mounted and polished using standard metallographic techniques.
Sample Surface. The surface condition of the sample is also critical. The finish must allow the correct extent of indentation to be measured.
Vibration. Vibration of the testing machine can cause erroneous readings. For this reason, the tester should be isolated from vibration to the degree possible.
Multiphase Sample Materials. A microhardness test is often used to show hardness gradients within multiphase materials. For general microhardness testing, a homogeneous sample is optimal, but in the case of a multiphase alloy, it is often necessary to take multiple hardness measurements so as to obtain an adequate sampling of different phases (grains) within the alloy. The sampling scheme would be determined on the basis of statistical calculation and the model that is chosen.
Sample Preparation. The treatment to which the sample is subjected prior to testing can cause microhardness data to display extreme scatter or be skewed. Preparation of the sample is often the single biggest variable over which the operator has influence. The remainder of this article discusses how sample preparation can affect microhardness readings.
AN INVESTIGATION INTO THE IMPORTANCE OF SAMPLE PREPARATION
An experiment was conducted in order to explore the way differences in sample preparation can affect microhardness test results. Various sample preparation methods and the material surfaces resulting from them that have either been observed or could reasonably be anticipated were investigated to determine their influence on hardness testing.
Samples. All of the test samples came from the same sheet of stainless steel, an austenitic type chosen for the experiment because it is easily work-hardened and would represent a worst-case scenario. Furthermore, austenitic stainless steels such as types 304, 316, and 316L are used extensively in the medical device industry. Deformation in metal causes a change in its dislocation structure, resulting in what is commonly referred to as work-hardening. When a sample is ground, the metal is deformed near the surface so as to produce a work-hardening gradient from the surface toward the core of the metal.
Test samples were removed from a 1/8-in.-thick sheet of Type-304 stainless steel such as would typically be used in machine shops. The samples all were mounted in the same manner, perpendicularly to the thickness plane of the material.
The grinding and polishing regimes that were investigated are outlined in Table I. The first three surface-treatment protocols were chosen because it was believed that they would vary enough from the standard ASTM method of preparing a sample to yield noticeable differences in hardness. Sample group 4 was prepared by a typical polishing method that is described in ASTM E3.
Sample Group | Grinding and Polishing Regime |
1 | 80 grit, 600 grit, 1-µm alumina, 0.05-µm alumina |
2 | 80 grit, 240 grit, 320 grit, 400 grit, 600 grit, 800 grit |
3 | 80 grit, 240 grit, 320 grit, 400 grit, 600 grit, 800 grit, electropolish |
4 | 80 grit, 240 grit, 320 grit, 400 grit, 600 grit, 800 grit, 1-µm alumina, 0.05-µm alumina |
Table I. Sample preparation methods used in the study.
Testing Regime. All of the microhardness tests were performed by the same operator using the same testing apparatus. The same indenter was used for all the testing. Before each group of samples was tested, the machine was checked for calibration; a standard block in the appropriate hardness range was used. Microhardness testing was performed at two loads, 100 g and 500 g, but with a constant time of 15 seconds. All testing was performed with reference to the Knoop hardness scale.
EXPERIMENTAL RESULTS
The final hardness data that were obtained from the testing appear in Table II. The results underscore the contention that the type of material treatment used in sample preparation is critical in determining the true microhardness of test samples.
Sample Group | Average Value in 500-g Hardness Testing | Standard Deviation in 500-g Hardness Testing | Average Value in 100-g Hardness Testing | Standard Deviation in 100-g Hardness Testing |
1 | 298.9 | 12.37 | 346.1 | 23.48 |
2 | 169.7 | 7.86 | 215.73 | 16.42 |
3 | 156.29 | 6.44 | 167.38 | 7.14 |
4 | 166.61 | 9.71 | 189.04 | 14.87 |
Table II. Results of the microhardness testing investigation.
Samples in group 1 presented the appearance of a highly polished surface free of scratches (see Figure 2). However, using only 600-grit sandpaper to remove the 80-grit (177-µm) sanding artifacts meant that minimal amounts of deformed metal were removed from the test piece. This sample group displayed artificially high hardness values—as much as 206% higher than values obtained using other polishing techniques. Low load levels exaggerated the high hardness values. Although the polishing method used for sample group 1 produces what seems to be a high-quality surface finish, it leaves a significant amount of deformed metal near the surface of the component, which results in erroneous and misleading hardness-testing results.
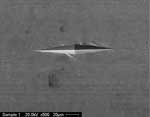 Figure 2. Micrograph showing an indentation of a sample from group 1. Note the smooth, scratch-free surface.
Sample group 2, by contrast, displayed only marginally higher hardness values than sample groups 3 and 4. Hardness readings for this group were relatively difficult to obtain owing to small scratches, and there was evidence that deformed metal was present at or near the surface (see Figure 3). The samples yielded significantly higher hardness values when tested with the lighter load. This result indicates that deformed material was tested. It is noteworthy that, in tests using the higher load (500 g), the mean hardness value of sample group 2 was not statistically distinguishable from that of sample group 4, the fully polished sample.
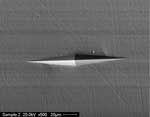 Figure 3. Micrograph showing an indentation on a sample from group 2. Note the many surface scratches.
The electropolished samples, sample group 3, had the lowest and most representative hardness values. This is not surprising, because electropolishing does not induce any mechanical deformation of the sample (see Figure 4). The hardness results obtained from tests using low loads were approximately the same as those for the best mechanically polished samples tested under high loads. Clearly, the electropolished samples were the ones with microindentation hardnesses closest to the true microhardness values of the bulk material.
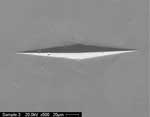 Figure 4. Micrograph showing an indentation on a sample from group 3. The electropolished surface is scratch free.
The fully polished sample in group 4, prepared with all of the intermediate sanding and polishing steps typically used in the device industry, provided slightly higher hardness values at low loads. This sample preparation method gives the most accurate values, at both high and low hardness-testing loads, of any of the mechanical polishing techniques.
Results obtained with microhardness tests using high loads will tend to minimize the effects of differences in sample preparation methods. However, some parts cannot be tested at high loads because of constraints presented by the nature of the samples.
DISCUSSION
The experiment showed that low-load hardness testing typically results in a somewhat higher value than that measured with high-load testing, owing to the fact that the work-hardened surface layer is more-superficially indented. When proper sample preparation techniques are employed, however, low-load test results should closely correlate with high-load results.
Microhardness testing should be performed on undeformed metal whenever possible. The most reliable sample preparation method for ensuring that the metal tested will be undeformed is electropolishing.
If electropolishing cannot be performed on a sample—for example, when dissimilar metals are in contact—careful and methodical sanding and polishing must be applied in order to ensure that deformed metal is not tested. This is especially critical at low loads. Because any mechanical material-removal process will create a deformation (work-hardening) gradient that affects the microhardness of the material, and since the deformation is most severe closest to the surface, low-load testing, with its minimal penetration, will yield results significantly influenced by the mechanical deformation.
Other differences between low-load and higher-load microhardness testing are worth noting. At lower loads, any surface effects are emphasized, fewer grains are tested (the effect is as if a nonhomogeneous material were being tested), and environmental influences such as vibration and air movement are exaggerated. The indentations are also smaller, resulting in more-critical measurement requirements. And with small indentations, minor differences in measurement result in vastly discrepant microhardness values. Whenever possible, samples should be tested using the highest possible load.
In order to ensure that test samples are properly prepared, test operators should be experienced in preparing metallographic samples. Metallographic sample preparation has been called a "black art," and it often takes considerable time and experience for operators to learn the techniques. ASTM E3 describes the appropriate methods. Because it can be necessary to devote significant resources to ensuring that accurate microhardness tests are performed on components, some organizations opt to use a qualified outside vendor to conduct the testing.
CONCLUSION
As the experimental results discussed here indicate, differences in sample preparation methodology can cause dramatic differences in microhardness test results. Variations in microhardness in the neighborhood of 100% were observed. Errors of that magnitude could lead to improper material specification or inadequate performance in critical medical dev- ice end-use applications, with attendant fiscal loss and possible liability.
Sample preparation methodologies that alter the test sample the least are to be preferred. Samples that are electropolished prior to microhardness testing yield the most accurate results.
Steve Ferry is manager of the pipe, pressure, metallurgy, and microscopy department at Hauser Laboratories (Boulder, CO), a full-service testing laboratory. Dana D. Tompkins, a metallurgical engineer formerly at Hauser, also contributed to this article.
Photo courtesy of Hauser Laboratories.
To the MDDI March 2001 table of contents | To the MDDI home page
Copyright ©2001 Medical Device & Diagnostic Industry
You May Also Like
Editors' Choice


.png?width=300&auto=webp&quality=80&disable=upscale)
Sponsored Content
May 23, 2024