Sign up for the QMED & MD+DI Daily newsletter.
A recent explosion in the number of granted U.S. medical device patents points to a bright future for the industry. Which regions are leading this innovation?
August 11, 2015
6 Min Read

A recent explosion in the number of granted U.S. medical device patents points to a bright future for the industry. Which regions are leading this innovation?
Scott Phillips, P.Eng.
In the last few years, there has been a dramatic worldwide increase in medical device patents granted in the United States. Between 2009 and 2014, this metric has grown by 170% and this positive trend is observable in all top patenting regions throughout the United States and nations around the world. I believe this boom in patents augurs well for the future success of our industry.
I recently stumbled upon this encouraging data while preparing for a talk on innovation in the device industry. My research took me to the U.S. Patent and Trademark Office (USPTO) patent database. The USPTO Patent Technology Monitoring Team published a wonderful summary report in 2015, reviewing granted medical device patents across 30 patent classes from 1995 to 2014. Their report analyzes results by year, location, and partly by company. I draw on their findings for much of this article.
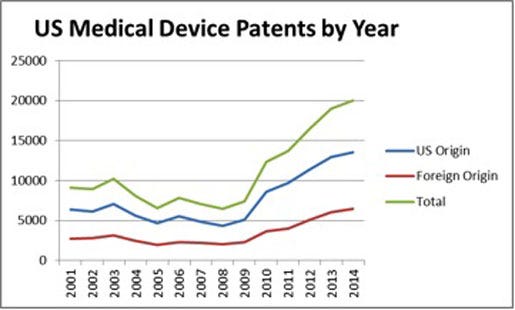
This chart summarizes results from the USPTO report.
A similar shape emerges in both domestic and foreign filings. From 2001 to 2009 the total number of medical device patents granted dropped about 25%. Starting in 2010, however, a dramatic change occurs and the numbers almost triple in the following five years from 7443 to 19,992.
Given that the average time from application to granting is approximately 36 months according to the PTO, these numbers actually lag by three years. So the jump in 2010 nominally corresponds to a jump in applications in 2007. What’s more remarkable is that the huge market crash of 2008–2009 should nominally have caused a drop in R&D budgets and a corresponding drop in granted patents three or four years later but that’s not what the data shows.
The Affordable Care Act was signed into law in 2010. The medical device tax went into effect in January 2013. Throughout this whole period the granted intellectual property in medical devices has been smoothly increasing. Most of the patents are of domestic origin, with 68% coming from within the United States in 2014.
I suspect this trend is driven by the increasing attractiveness of the industry driven by demographics and cost pressure driving innovation. Over the same timeframe the total delay time to grant a patent has dropped by about one-third, from 35 months to 27 months on average, so some portion of the observed increase is likely due to faster processing.
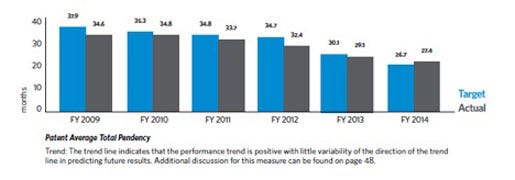
This chart is from the USPTO 2014 Annual Report.
Drilling down to the U.S. state level, it’s no surprise that California is way out in front but it was a bit shocking to see by just how much. All the major centers in California are known as medical device industry hubs. San Francisco and the Bay Area is an epicenter of digital health, San Diego is a biotech capital, and Los Angeles and Irvine are well known for medical devices and ophthalmology. California is also by far the most populous state in the country with 38 million people.
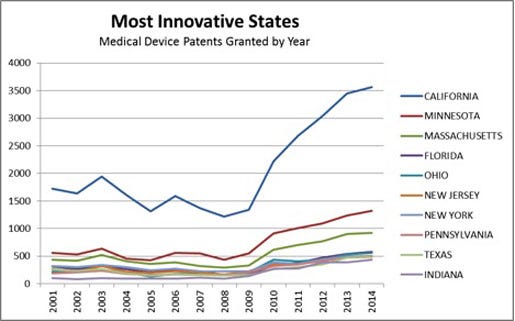
Minnesota is a remarkably heavy hitter in intellectual property for a smaller state with under 6 million people. It has a huge medical device industry, particularly in cardiovascular. Then comes Massachussets, with greater Boston, MIT, and Harvard.
The lesser-known (for some) states in the mix might be Florida, New Jersey, Texas, and Indiana. Tiny Warsaw, Indiana, population 13,000, is known as the “orthopedic capital of the world” with DePuy, Zimmer, and Biomet all headquartered there.
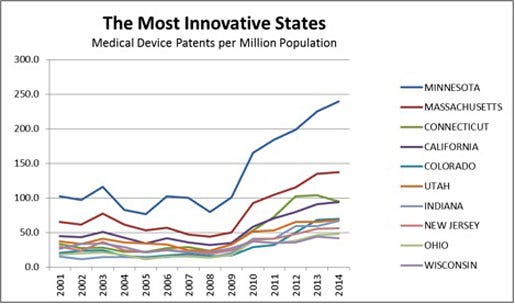
Interestingly, when the data is normalized for population, a different order emerges. Minnesota, with a population of 5.5 million, now leads by a considerable margin, followed by Massechusetts, Connecticut, and then California. Clearly these states have economies with a heavy focus on the medtech sector. Wisconsin, Colorado, and Connecticut are the newcomers to the top ten list with Texas, New York, and Florida falling farther down the list.
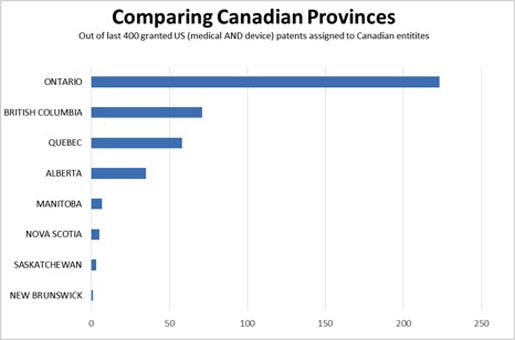
Because I'm Canadian, work in the Canadian medtech industry, and was researching this data for a talk held in Toronto, I decided to dig deeper on the U.S. medical device patents assigned to Canadian entities. Ontario, the largest province with the most diverse medical device sector, is by far the largest filer of US patents. There are two clusters in Toronto and in southwest Ontario (including London, Kitchener-Waterloo, and Cambridge) as well as some activity in Ottawa and Kingston. Next is British Columbia, with the industry centered mostly in Vancouver. Quebec is mostly known for pharmaceutical companies such as Valeant, in Montreal, but has some medical device companies like Medtronic Cryocath. Then comes Alberta with most of the medical device patenting coming from Edmonton. The 400 patents shown represent almost exactly a full year of patenting from July 2014 to June 2015. The numbers are not large but they have grown by a factor of four since 2009-—which is proportionally more than even the United States. Whatever is in the water driving this innovation in the United States is also present in Canada.
Going back to the USPTO report, it is interesting to look at the most active countries in the world.
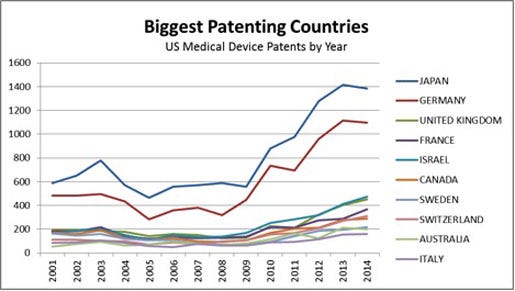
Japan and Germany are the dominant countries in terms of granted U.S. medical device patents. The curve shapes are nearly identical in almost all cases with a slow decline through 2008 or 2009, followed by a dramatic rise.
Six of the top ten patenting countries are in Europe, led by Germany, the United Kingdom, and France. Japan is the lone Asian country represented. Israel is an amazing story, with its tiny population and huge industry footprint projecting from the Middle East. Canada, the other North American country, and Australia round out the list. Both Japan and Germany saw nominal declines last year. China has not cracked the top ten yet. It’s actually 19th on the list, with 500 U.S. patents granted since 1995.
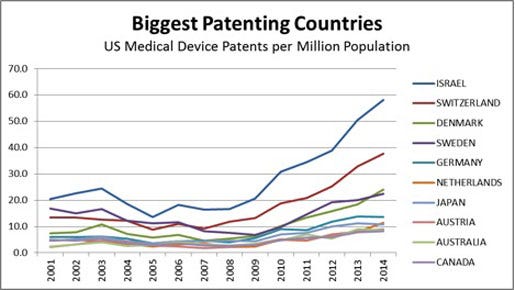
When population is taken into account the results change a lot, though almost all the same countries make the population-adjusted list. Now Israel, population 8.2 million, jumps to the top of the list. Israel is to the world of medical devices what Minnesota is to the U.S., with a medtech-focused economy. Switzerland, with a similar population, isn’t far behind. The next country on the list, Denmark, had less than half as many patents per person granted in 2014 as Israel.
The total patents per person in the international group are lower than the domestic group, at 8–60 patents per million people per year versus 50–250 patents per million people per year for the top US states. I suspect that most of the difference lies with the "home field advantage" of domestic filings, but it’s possible that Americans are simply more inclined to patenting.
This closer examination of patents trends provides unique insights into the state of innovation in the world of medical devices and leaves me more optimistic about the future of medtech.
Scott Phillips B.A.Sc, P.Eng., is president of StarFish Medical, a medical device design company headquartered in Victoria, British Columbia
Hear more from Scott Phillips at MEDevice San Diego, September 1–2, 2015, in San Diego. He will be speaking on “What’s Hot in Regulated Design Control: Analyzing FDA Trends” |
[Images courtesy of STUART MILES/FREEDIGITALPHOTOS.NET, STARFISH MEDICAL, AND USPTO]
You May Also Like